Travel pollution index
The UK’s greenest airports and areas for air quality revealed
In July, 325 new rapid and ultra-rapid EV charging points were installed across the UK.¹
As the nation strives to reduce the effects of global warming and engage in more eco-tourism, the experts at DriveElectric wanted to reveal the UK’s greenest areas and airports.
We looked at the air pollution index and the use of low-emissions cars and buses across the UK. We also analysed each UK airport’s carbon neutral status, CO2 emissions and passenger numbers.
The greenest areas in the UK
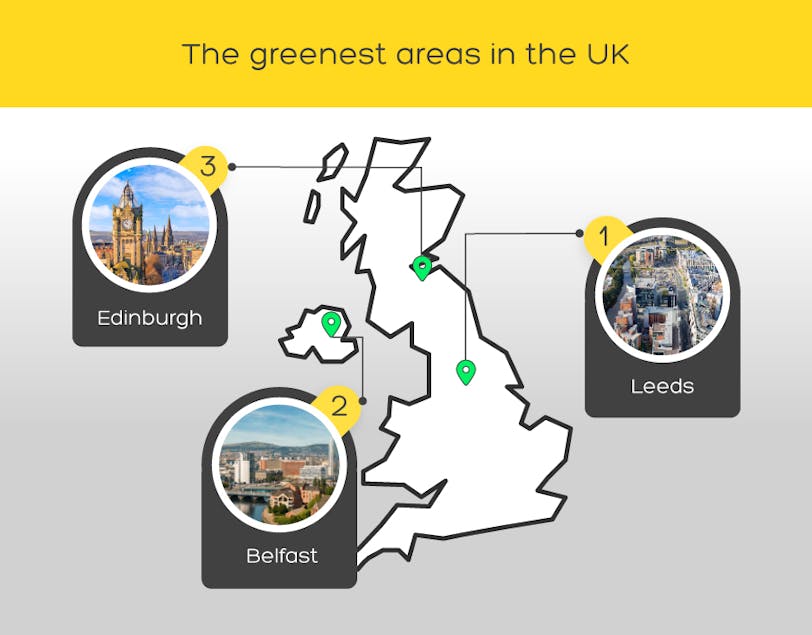
1. Leeds
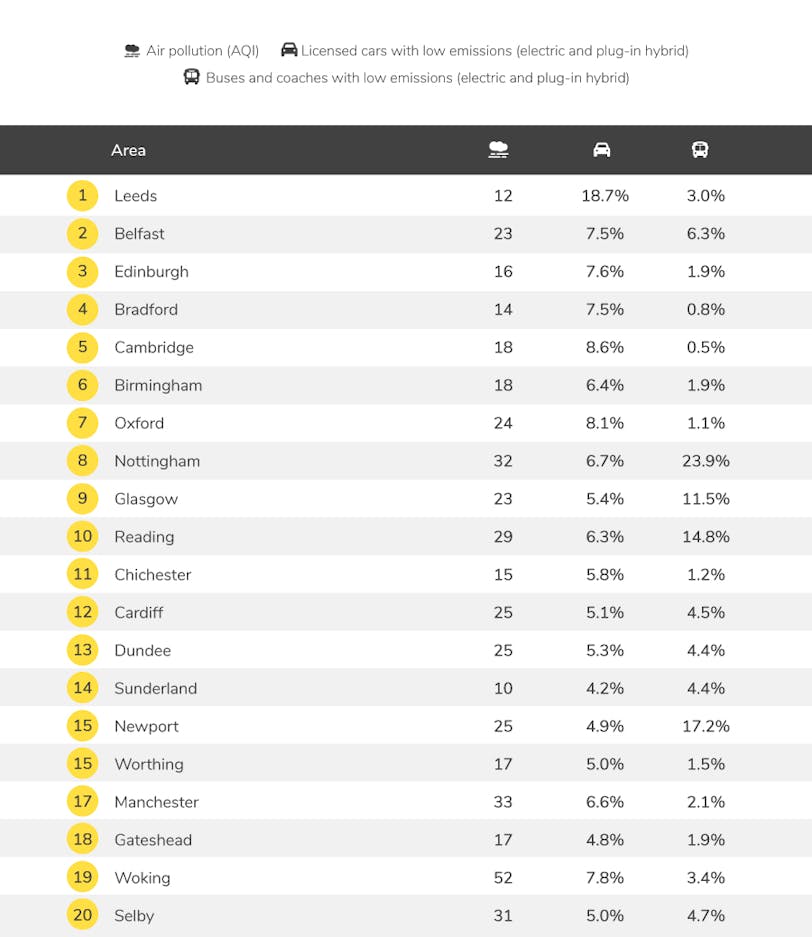
Leeds is the UK’s greenest city, based on air quality, low-emissions cars and low-emissions buses. The capital of Yorkshire has an air quality index of 12. A value of 50 or below generally indicates good air quality. The Leeds population is also switching to greener modes of transport faster than most areas in the UK. Over one in six (18.7%) licensed cars and 3% of buses and coaches in Leeds are either plug-in hybrids or electric vehicles. While there is still a long way to go before the city eliminates most travel pollution, it is clear that Leeds is leading the way in the UK.
2. Belfast
Northern Ireland’s capital is one of the most eco-friendly areas in the UK based on low emissions transport and air quality. Belfast has an air quality index of 23, well below 50, which usually indicates good air quality. Around 7.5% of cars licensed in Belfast and 6.3% of buses and coaches are low emissions, including plug-in hybrids or electric vehicles. Belfast ranks in second place as one of the most green cities when it comes to transport, although there is still much work to be done.
3. Edinburgh
The Scottish city of Edinburgh is known for its natural spaces, so it’s no surprise that this area is one of the greenest in the UK. The air quality index in Edinburgh is 16, indicating clean air. Around 7.6% of cars licensed in the area have low emissions, and 1.9% of buses are plug-in hybrids or electric vehicles. It is clear that Edinburgh still has a long way to go in eliminating traffic pollution, although the city ranks in the top five for low emissions cars. This indicates residents of Edinburgh are adopting electric cars and plug-in hybrid vehicles faster than those in most other cities.
The greenest London boroughs
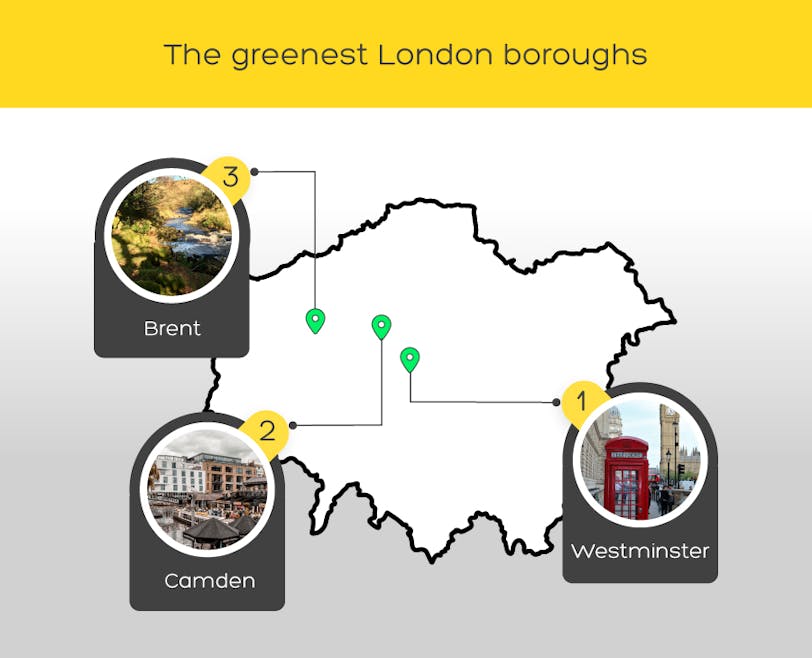
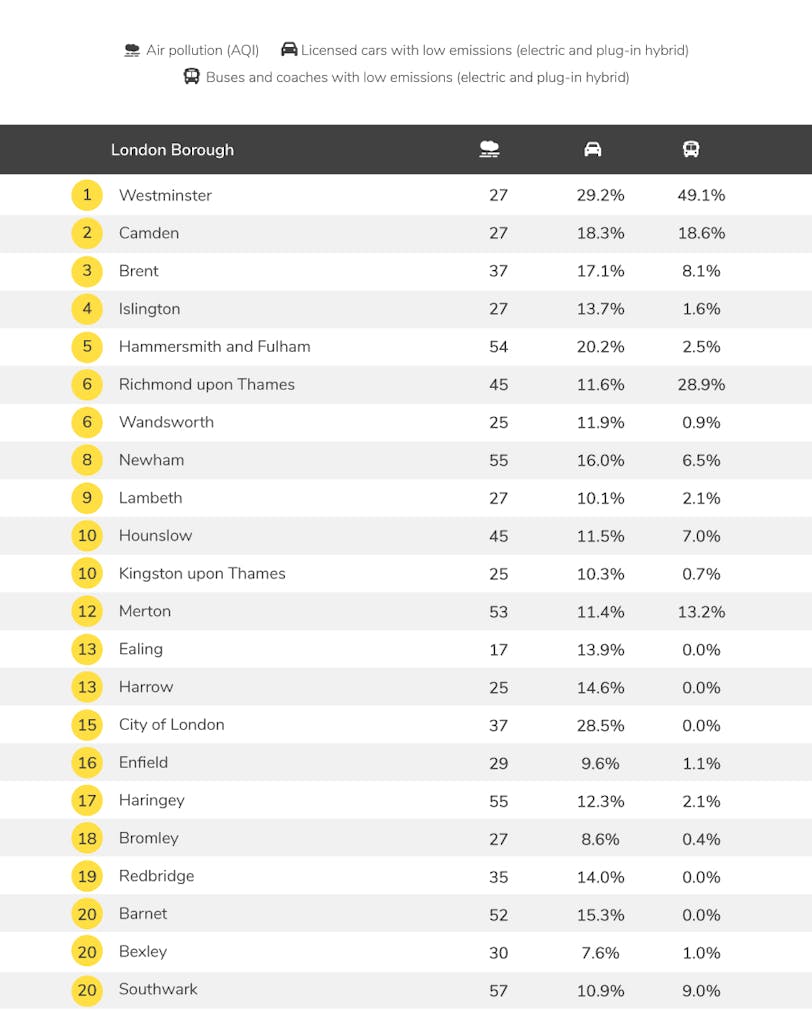
1. Westminster
Westminster is London’s greenest borough, based on air quality, low-emissions cars and low-emissions buses. The borough has an air quality index of 27, with a value of 50 or below generally indicating good air quality. Westminster residents are making the switch to greener modes of transport, with just under a third (29.2%) of licensed cars and almost half (49.1%) of buses and coaches being either plug-in hybrids or electric vehicles. While this does not represent the majority of vehicles in the area, Westminster is the London borough leading the way towards reducing traffic pollution.
2. Camden
Camden is one of the most eco-friendly areas of London based on low emissions transport and air quality. Camden has an air quality index of 27. Almost one in five (18.3%) cars licensed in Camden and almost one in five (18.6%) buses and coaches are low emissions, including plug-in hybrids or electric vehicles. Camden still has much work to do when it comes to becoming green, although it is home to more than twice as many low emissions cars as Lewisham, Sutton, Bromley, Havering and Bexley.
3. Brent
Brent is one of the greenest London boroughs. The air quality index in Brent is 37, indicating clean air. Around 17.1% of cars licensed in the area have low emissions, and 8.1% of buses are plug-in hybrids or electric vehicles. While there is still a long way to go in becoming green, Brent has more low emissions busses and coaches than 25 London boroughs, including Hounslow and Newham.
The greenest airports in the UK
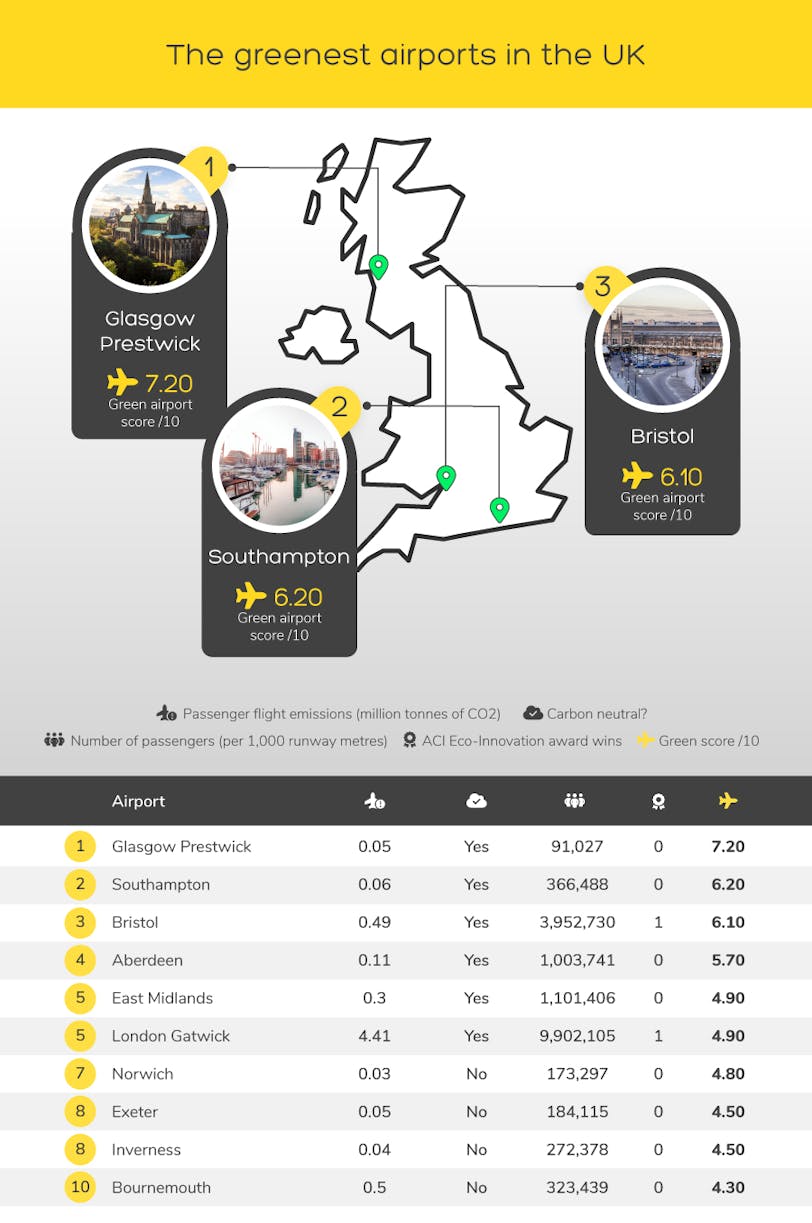
1. Glasgow Prestwick | Green airport score: 7.20/10
Glasgow Prestwick is an international airport located south of Glasgow City, and it sees around 6.4 million fewer passengers than Glasgow Airport. The airport produced 0.05 million tonnes of CO2 in passenger flight emissions and has committed to carbon neutrality. Glasgow Prestwick is also one of the quietest airports in the UK, welcoming just 91,027 passengers for every 1,000 metres of runway last year.
2. Southampton | Green airport score: 6.20/10
Southampton Airport is one of the UK’s greenest, located near the Channel Coast. The airport is committed to carbon neutrality and saw just 366,488 passengers per 1,000 runway metres last year. Southampton Airport also produced 0.06 million tonnes of CO2 in passenger flight emissions, lower than most airports in the UK.
3. Bristol | Green airport score: 6.10/10
Bristol Airport is an international travel hub and ranks as one of the UK’s greenest. The airport is carbon-neutral and welcomed just under four million passengers for every 1,000 runway metres last year. Bristol Airport was awarded the ACI Eco-Innovation prize in 2023, demonstrating the airport’s commitment to sustainable travel. Bristol Airport also produced just 0.49 million tonnes of CO2 in passenger flight emissions, compared to the highest polluting airport, London Heathrow, responsible for 16.2 million tonnes of CO2.
The least green airports in the UK
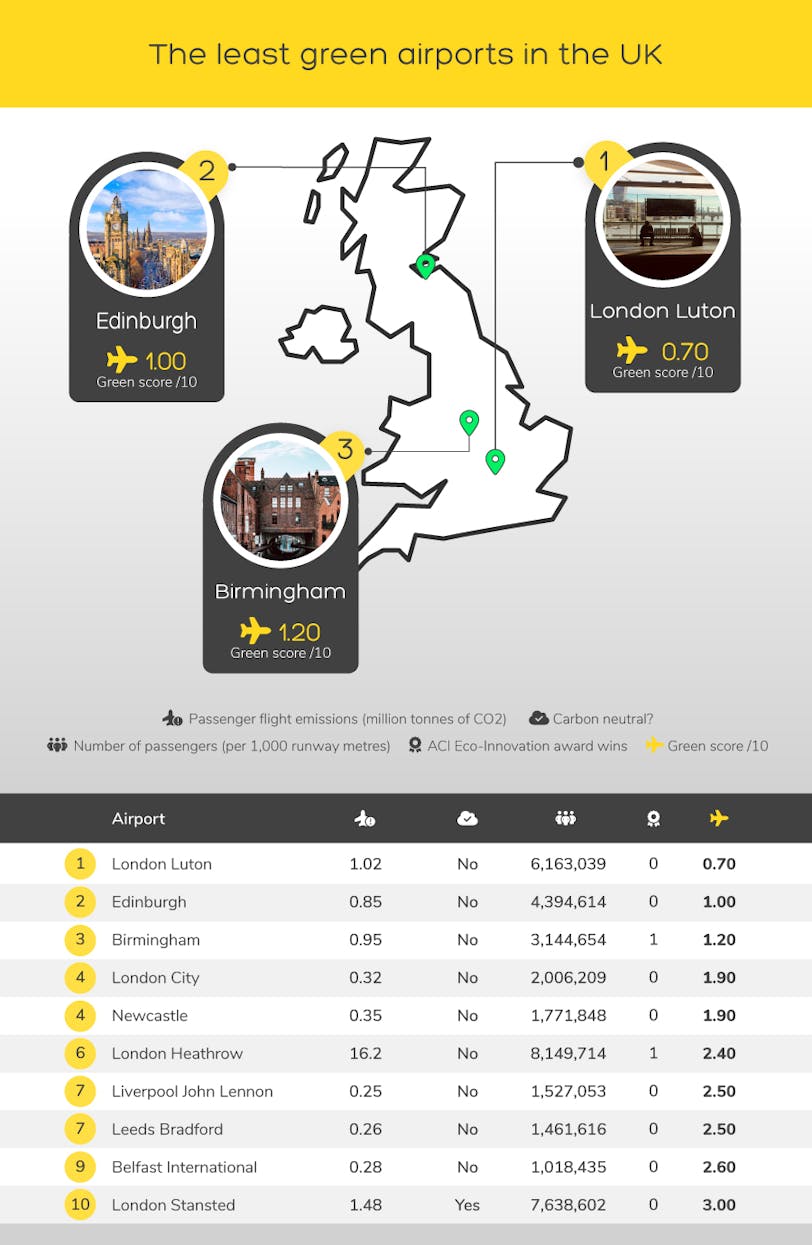
1. London Luton | Green score: 0.70/10
London Luton Airport is the least green in the UK, scoring just 0.70 out of 10 for the factors we looked at. The airport has not yet achieved carbon neutrality and was responsible for 1.02 million tonnes of CO2 in passenger flight emissions. It is also one of the busiest airports, with almost 6.2 million passengers for every 1,000 runway metres.
2. Edinburgh | Green score: 1.00/10
Edinburgh Airport is the least green airport in Scotland. It is also one of Scotland’s most-visited airports, with almost 4.4 million passengers per 1,000 metres of runway last year. The airport produced 0.85 million tonnes of CO2 in passenger flight emissions in 2022 and is not yet carbon-neutral.
3. Birmingham | Green score: 1.20/10
Birmingham Airport is the busiest airport in the Midlands, seeing over 3.1 million passengers for every 1,000 metres of runway last year. The airport is also one of the least green in the UK. It is still working towards carbon neutrality and produced 0.95 million tonnes of CO2 in passenger flight emissions last year.
The area with the greenest public transport in the UK
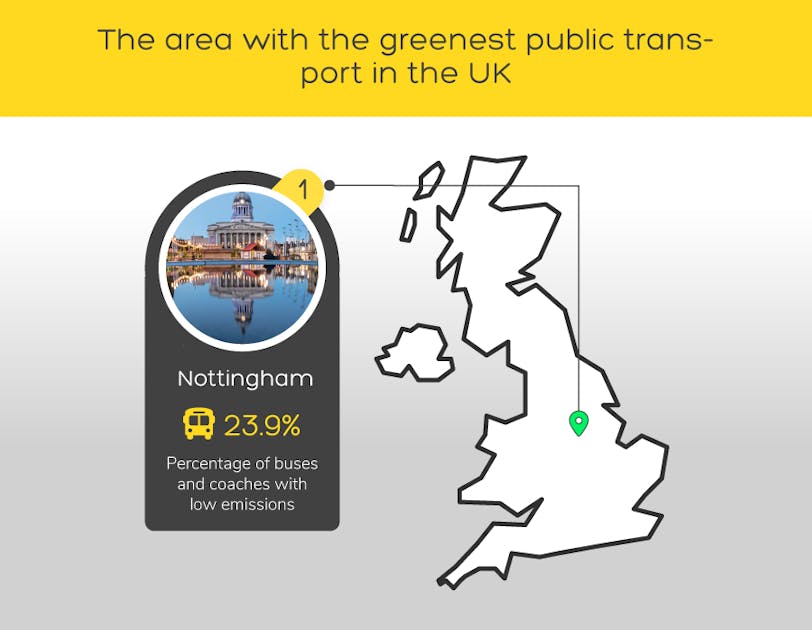
1. Nottingham
Percentage of buses and coaches with low emissions: 23.9%
The UK's most sustainable city for public transport is Nottingham, with 23.9% of its buses and coaches having low emissions. In 2020, the city had over 178 buses running on electricity. The city’s public transport system is also extremely popular, with more than 40% of all journeys made by bus or tram. In a bid to achieve its goals for a greener city, Nottingham’s council have laid out plans to be carbon neutral by 2028.
The London borough with the greenest public transport in the UK
1. Westminster
Percentage of buses and coaches with low emissions: 49.1%
Westminster is the area with the greenest public transport in the UK, with 49.1% of its buses and coaches having low emissions. Situated at the heart of London, Westminster also provides a sustainable transport system throughout the city. The region has installed extra EV charging points, developed a residential electric charging point scheme with Streetcharged and converted 25% of its car club vehicles to hybrid electric vehicles.
The area with the greenest cars in the UK
1. Leeds
Percentage of licensed cars with low emissions: 18.7%
Leeds has the greenest vehicles, with over one in six (18.7%) licensed cars having low emissions. The city is also home to 63.5 electric vehicle charging devices per 100,000 population - more than most other cities in the UK.
The London borough with the greenest cars in the UK

1. Westminster
Percentage of licensed cars with low emissions: 29.2%
The London borough of Westminster is the leading borough in low-emissions buses, coaches, and cars. Under a third (29.2%) of all cars licensed in Westminster are classed as having low emissions, being plug-in hybrids or electric vehicles.
Methodology
We wanted to reveal the UK’s greenest areas, so we looked at the air pollution index and the percentage of cars, buses and coaches with low emissions in each UK area. We looked at the most populated towns and cities in the UK. As the data also includes places with EV leasers, such as Slough and brokers areas, we removed areas with brokers to ensure the data is as accurate as possible. Places with 5,000 or more low-emissions vehicles and a population of fewer than 300,000 people were removed.
The air pollution index of each area was sourced from IQAir and was unavailable from AccuWeather on 27th September 2023.
The percentage of cars with low emissions in each town and city was sourced from the Department for Transport and Driver and Vehicle Licensing Agency VEH0105, looking at licensed cars using ‘other fuels’ and hybrid electric cars under ‘total’ keepership as of 2023 Q1.
The percentage of buses and coaches with low emissions in each area was sourced from the Department for Transport and Driver and Vehicle Licensing Agency VEH0105, looking at buses and coaches using ‘other fuels’ and hybrid electric buses and coaches as of 2023 Q1 under ‘total’ keepership.
We then ranked each area by giving it a normalised score out of 10 for each factor before calculating an average score across all factors. This formed the basis of our ranking. We ranked London boroughs separately to towns and cities.
We also wanted to reveal the UK’s greenest airports, looking at passenger numbers, carbon neutrality, ACI eco-innovation award wins and flight emissions of passengers (million tonnes of CO2). We looked at all UK airports with available data.
We sourced the flight emissions of passengers (million tonnes of CO2) for each airport using AirportTracker.
We sourced each airport’s carbon-neutral status from the Airport Carbon Accreditation, and each airport’s sustainability report where unavailable.
We sourced the number of passengers that used each airport in 2022 using the UK Civil Aviation Authority Annual Airport Data 2022. We calculated the number of passengers per 1,000 metres of the runway at each airport, sourced from each airport’s website and Wikipedia and Airport-Technology where unavailable.
We sourced the number of ACI eco-innovation award wins by each airport from the Airports Council International Europe. We looked at wins between 2013 and 2023.
We then ranked each airport by giving it a normalised score out of 10 for each factor before calculating an average score across all factors.