ICE vehicles vs electric vehicles
Where in the UK is the most expensive to drive ICE vehicles vs EVs?
The UK hopes to be a carbon-neutral nation by 2050, and the plan to achieve this is by cutting carbon emissions in various areas. One such area is vehicle emissions, produced by internal combustion engines. The UK plans to stop selling ICE vehicles by 2030, with low-emission hybrids and EVs being the sole remaining options.
With that said, if you need a vehicle ahead of 2030, you could consider our electric car leasing services.
The price of electricity and petrol, as well as diesel, has seen a lot of change in recent times. However, fuel prices have fallen considerably, whereas electricity is mostly holding it’s high cost of use. But, with that said, will electric cars be more expensive to run than their petrol and diesel counterparts.
As such, our experts at DriveElectric have looked into where are the most expensive places in the UK to fuel an ICE vehicle, compared to an electric vehicle. We have also looked at clean air zones and ultra-low emission zones, as well as doing a survey to see which type of vehicles people drive and the sentiment towards ultra-low emission zones.
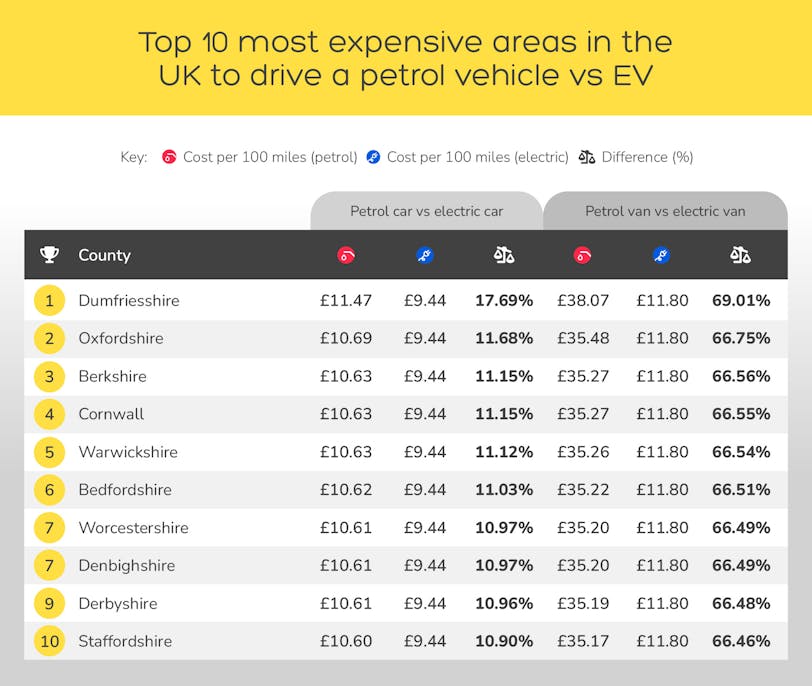
The most expensive areas in the UK to drive a petrol vehicle vs EV
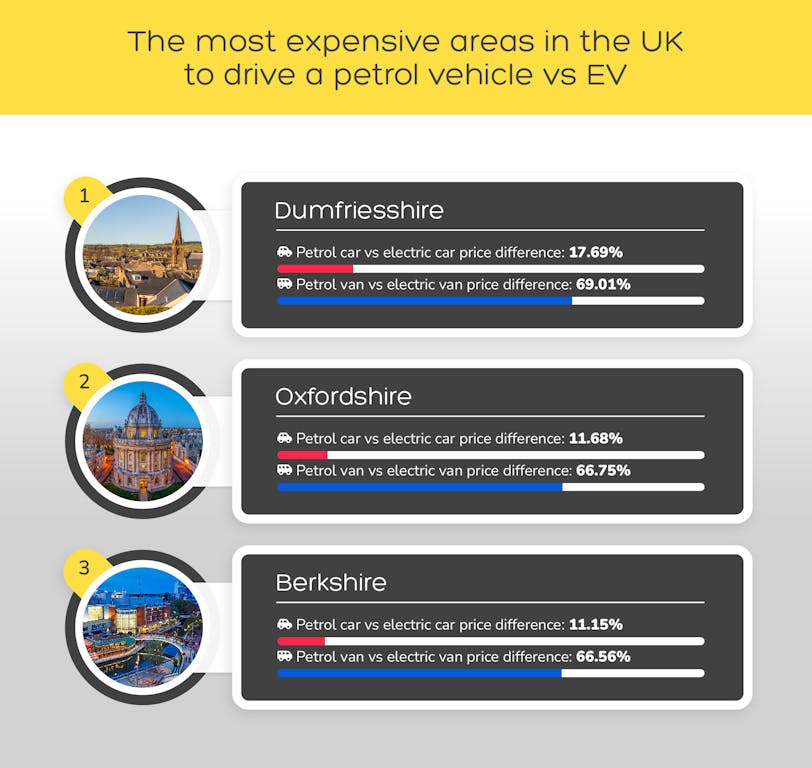
1. Dumfriesshire
Petrol Car vs Electric Car Price Difference: 17.69%
Petrol Van vs Electric Van Price Difference: 69.01%
Coming out as the area with the biggest cost of running a petrol internal combustion engine car, in the UK, is Dumfriesshire. The average cost of petrol in the area is £1.64 per litre. When calculated as per 100 miles, it costs £11.47 to fuel a petrol car, which is 17.69% higher than the cost of running an electric car per 100 miles. It costs around 69.01% more to run a petrol van per 100 miles when compared to an electric van.
2. Oxfordshire
Petrol Car vs Electric Car Price Difference: 11.68%
Petrol Van vs Electric Van Price Difference: 66.75%
Oxfordshire is the second-most expensive location in the UK to run an ICE vehicle, at £1.53 per litre. Per 100 miles it costs around £10.69 to run a car with an ICE, which is 11.68% more than the cost to run an electric car per 100 miles. And as for vans, it costs around 66.75% more than an electric model.
3. Berkshire
Petrol Car vs Electric Car Price Difference: 11.15%
Petrol Van vs Electric Van Price Difference: 66.56%
And taking third place, we have Berkshire, where petrol costs around £1.52 per litre. Per 100 miles, it costs £10.63 to fuel an ICE petrol car in this area, 11.15% higher than the £9.44 it costs to run an electric car per 100 miles. And it costs 66.56% more to run a petrol van when compared to an electric one.
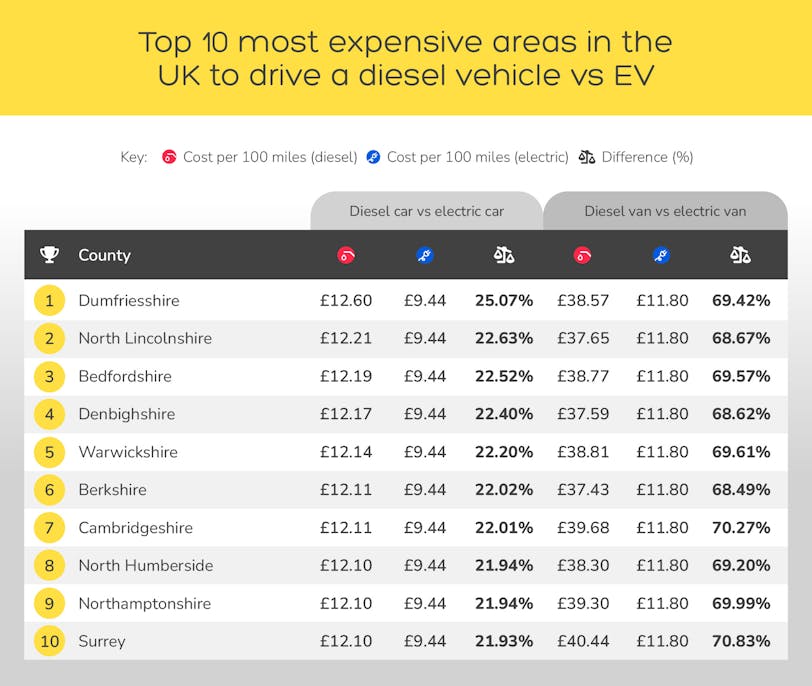
The most expensive areas in the UK to drive a diesel vehicle vs EV
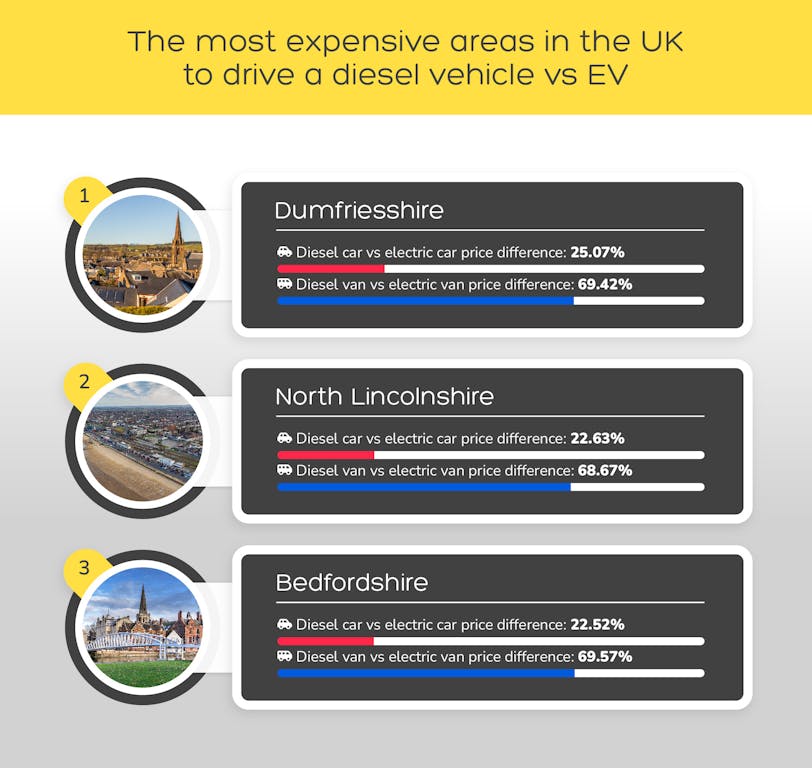
- Dumfriesshire
Diesel Car vs Electric Car Price Difference: 25.07%
Diesel Van vs Electric Van Price Difference: 69.42%
Dumfriesshire also comes out on top for areas in the UK with the highest cost of running a diesel ICE. Per 100 miles, it costs £12.60 to run a diesel car, which is around 25.07% more expensive than running an electric car per 100 miles. And as for vans, it costs around 69.42% more to run a diesel van compared to an electric van.
- North Lincolnshire
Diesel Car vs Electric Car Price Difference: 22.63%
Diesel Van vs Electric Van Price Difference: 68.67%
In second place, for areas in the UK where the cost of running a diesel ICE is highest, we have North Lincolnshire. It costs 22.63% more to run a diesel internal combustion engine car than an electric car per 100 miles. Furthermore, it costs 68.67% to run a diesel van versus an electric van.
3. Bedfordshire
Diesel Car vs Electric Car Price Difference: 22.52%
Diesel Van vs Electric Van Price Difference: 69.57%
And in third place, we have Bedfordshire, the average cost of diesel per litre is £1.74, which means it costs £12.19 to run a diesel car in this area. When calculated per 100 miles, that sum is around 22.52% more than running an electric car. It also costs £38.77 per 100 miles to run a diesel van, which is 69.57% more than an electric van.
Clean air zones in the UK
Clean air zones are areas in the UK where local governments have chosen to target emissions and attempt to improve air quality. At present, there are only six such zones active in the UK, which increases to seven if you include the ULEZ in London.
The areas with clean air zones currency are Bath, Birmingham, Bradford, Bristol, Newcastle and Portsmouth. There were plans for Manchester, Leeds and Leicester, as well as other cities to have clean air zones introduced by now, but plans were scrapped, as some local councils opted for other options such as fitting buses and other high-polluting vehicles with better filters to reduce emissions.
Furthermore, some areas have implemented measures instead of a clean air zone, but do not charge people for having highly polluting vehicles. Southampton for instance has retrofitted buses and made efforts to use more green fuels. Nottingham has also taken similar measures.
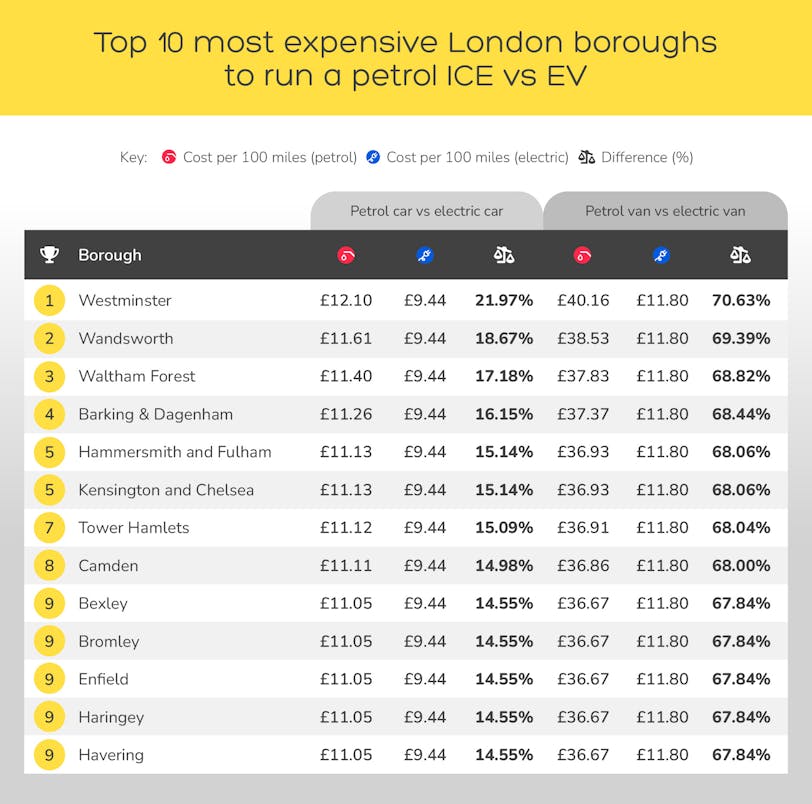
The most expensive London boroughs to run a petrol ICE vs EV
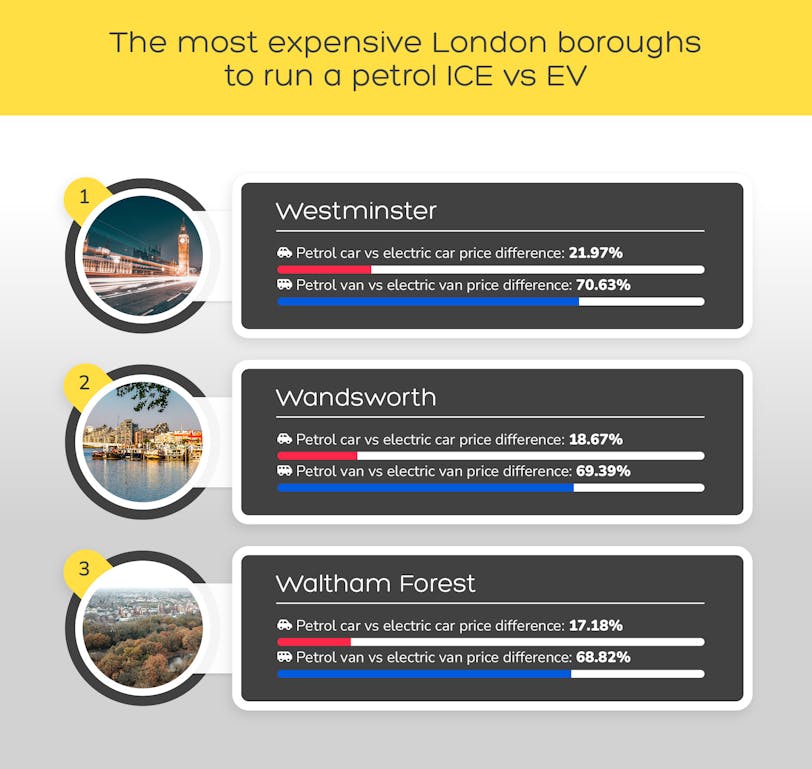
1. Westminster
Petrol Car vs Electric Car Price Difference: 21.97%
Petrol Van vs Electric Van Price Difference: 70.63%
Westminster comes out on top as the London borough with the highest cost for running a petrol engine, versus an electric one. It costs around £1.73 per litre for petrol in this borough. Per 100 miles it costs £8.32 to run a petrol car and £40.16 for a van, meaning that it costs 21.97% more for the former and 70.63% for the latter when compared to their electric counterparts.
2.Wandsworth
Petrol Car vs Electric Car Price Difference: 18.67%
Petrol Van vs Electric Van Price Difference: 69.39%
Wandsworth is the London borough that comes in second in London for the most expensive places to run a petrol internal combustion engine. It costs £1.66 per litre for petrol in this borough. Meaning petrol cars cost around 18.67% more than electric cars and a petrol van costs 69.39% more than an electric van when calculated per 100 miles.
3. Waltham Forest
Petrol Car vs Electric Car Price Difference: 17.18%
Petrol Van vs Electric Van Price Difference: 68.82%
Waltham Forest has a cost of £1.63 per litre for petrol, making it the third most expensive borough in London to run a petrol ICE. When calculated per 100 miles, it costs 17.18% more to run a petrol car than an electric car. And it costs 68.82% more to run a petrol van, compared to an electric van, per 100 miles.
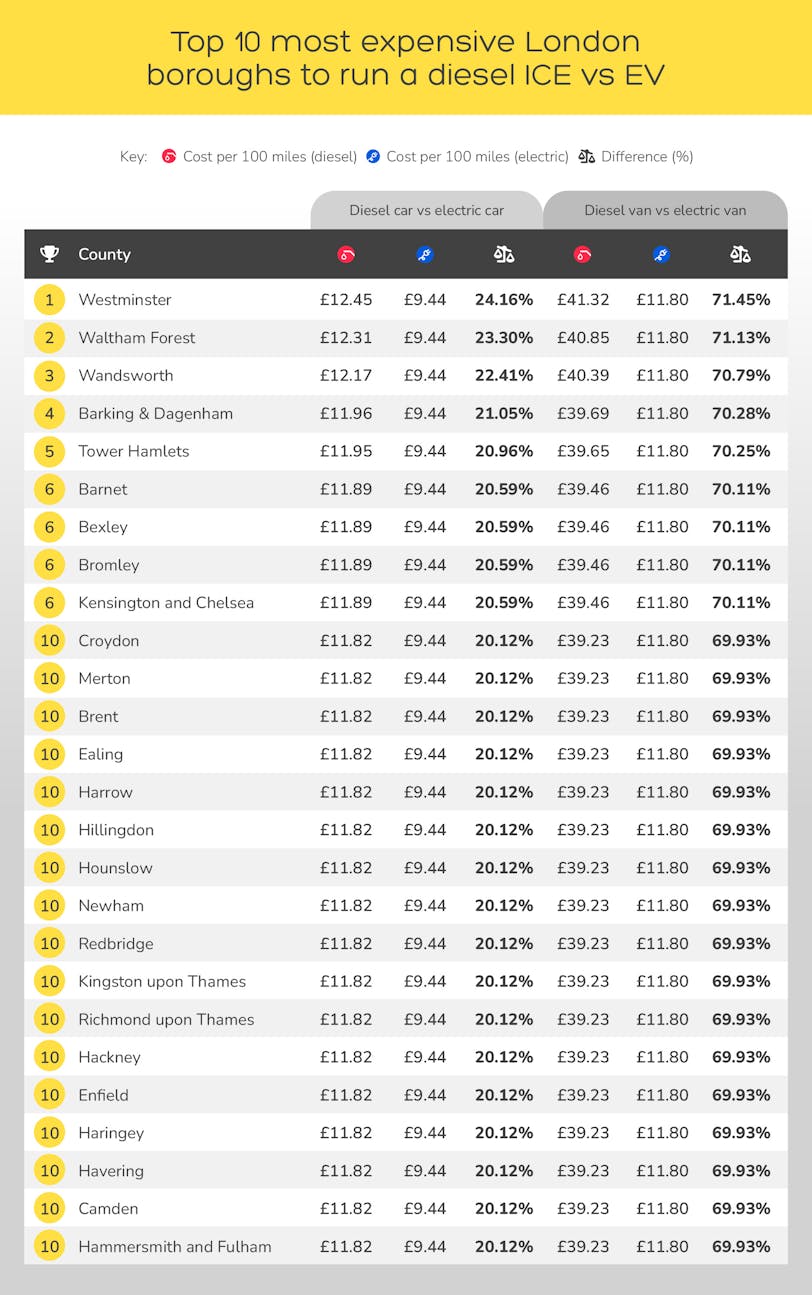
The most expensive London boroughs to run a diesel ICE vs EV
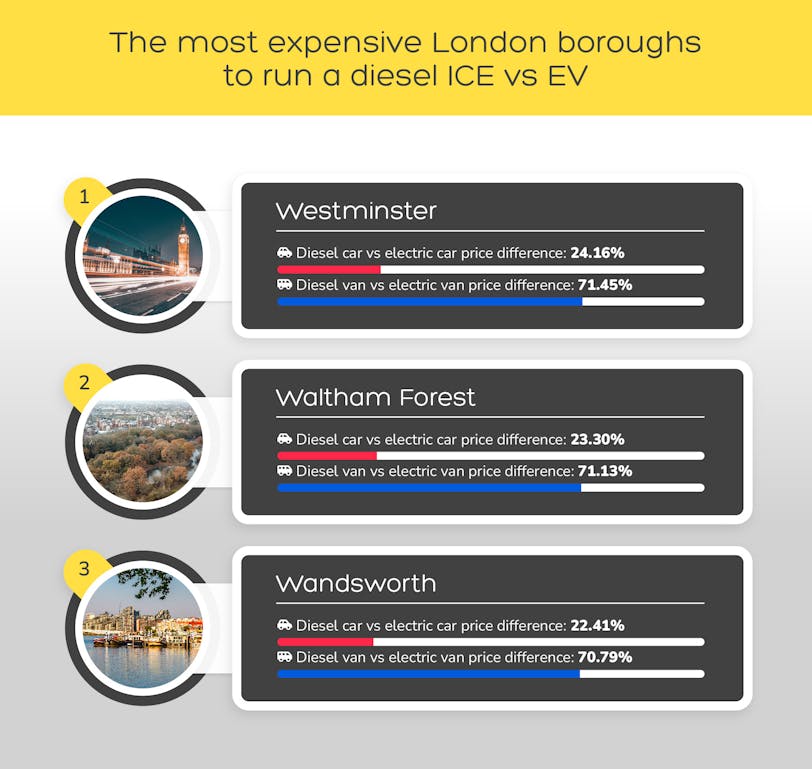
1. Westminster
Diesel Car vs Electric Car Price Difference: 24.16%
Diesel Van vs Electric Van Price Difference: 71.45%
Westminster again comes out on top as the London borough where it is most expensive to run an internal combustion engine, this time for specifically diesel vehicles. The price per litre for diesel in Westminster is £1.78. Given that, the cost of running a diesel car is 24.16% more than an electric car, per 100 miles. For diesel vans, it costs around 71.45% more than electric vans, when calculated per 100 miles.
3. Waltham Forest
Diesel Car vs Electric Car Price Difference: 23.30%
Diesel Van vs Electric Van Price Difference: 71.13%
Waltham Forest this time comes in second place, with the cost of £1.76 per litre for diesel. Per 100 miles, it costs £12.31 to run a diesel car compared to £9.44 for an electric vehicle. Whereas for vans it costs £40.85 for a diesel and £11.80 for an electric van. As such, it costs 23.30% more to run a diesel car and 71.13% for a van, when compared to their electric counterparts.
3. Wandsworth
Diesel Car vs Electric Car Price Difference: 22.41%
Diesel Van vs Electric Van Price Difference: 70.79%
And in third place, we have Wandsworth, with a price of £1.74 per litre for diesel, as such it costs around £12.17 to run a diesel car and £40.39 for a van, per 100 miles. Those figures mean it costs 22.41% more for the former and 70.79% for the latter when compared to their electric counterparts.
Ultra-Low Emission Zone
The ultra-low emission zone is an area in London that was put in place in 2019, where a fee is charged to those who drive vehicles that contribute high amounts of pollution. Shortly after its introduction, emissions were shown to decrease by around 20%, however, the improvements to air quality were minimal.
At current, it only covers a portion of London and encompasses just a handful of boroughs, however, in an attempt to reduce emissions and improve public health, there will be an expansion. From the 29th of August 2023, the ultra-low emission zone will cover all the London boroughs.
Under the newly expanded zone, people will be charged £12.50 daily, if their vehicle does not meet the emissions standards, which will be put in place with the zone.
What type of vehicles do people in the UK drive?
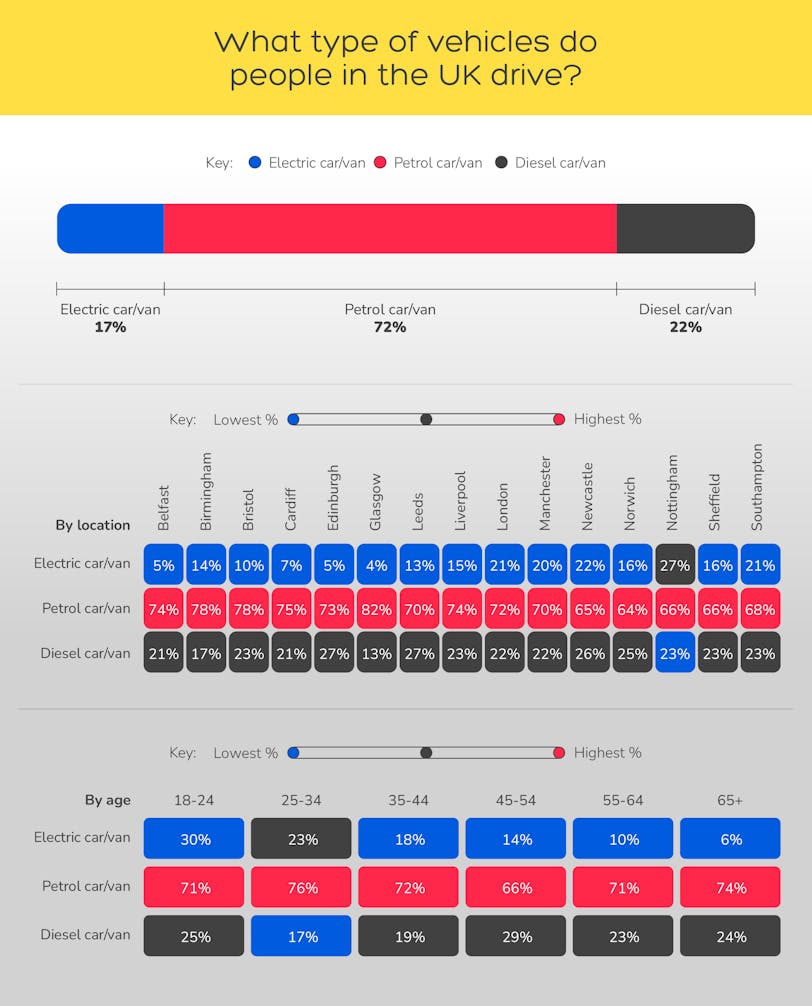
As our survey shows, people most typically drive petrol cars or vans, with almost three-quarters of the 2,001 respondents replying as such. This is a huge gulf, compared to over one in six (17%) of people that drive electric cars.
Nottingham is the city in the UK where people tend to drive electric vehicles the most, with more than a quarter of the respondents saying as such. And in Belfast, one in twenty (5%) people responded that they drive electric cars.
And as for the different age groups, 18 to 24-year-olds were the bracket that tend to drive electric cars the most, with people 65 and older the least likely to drive them. And 25 to 34-year-olds, the age group with the second-highest number of responses to the survey, are most likely to drive petrol vehicles, with just over three-quarters (76%) saying as such.
What is the public opinion about ultra-low emission zones in the UK?
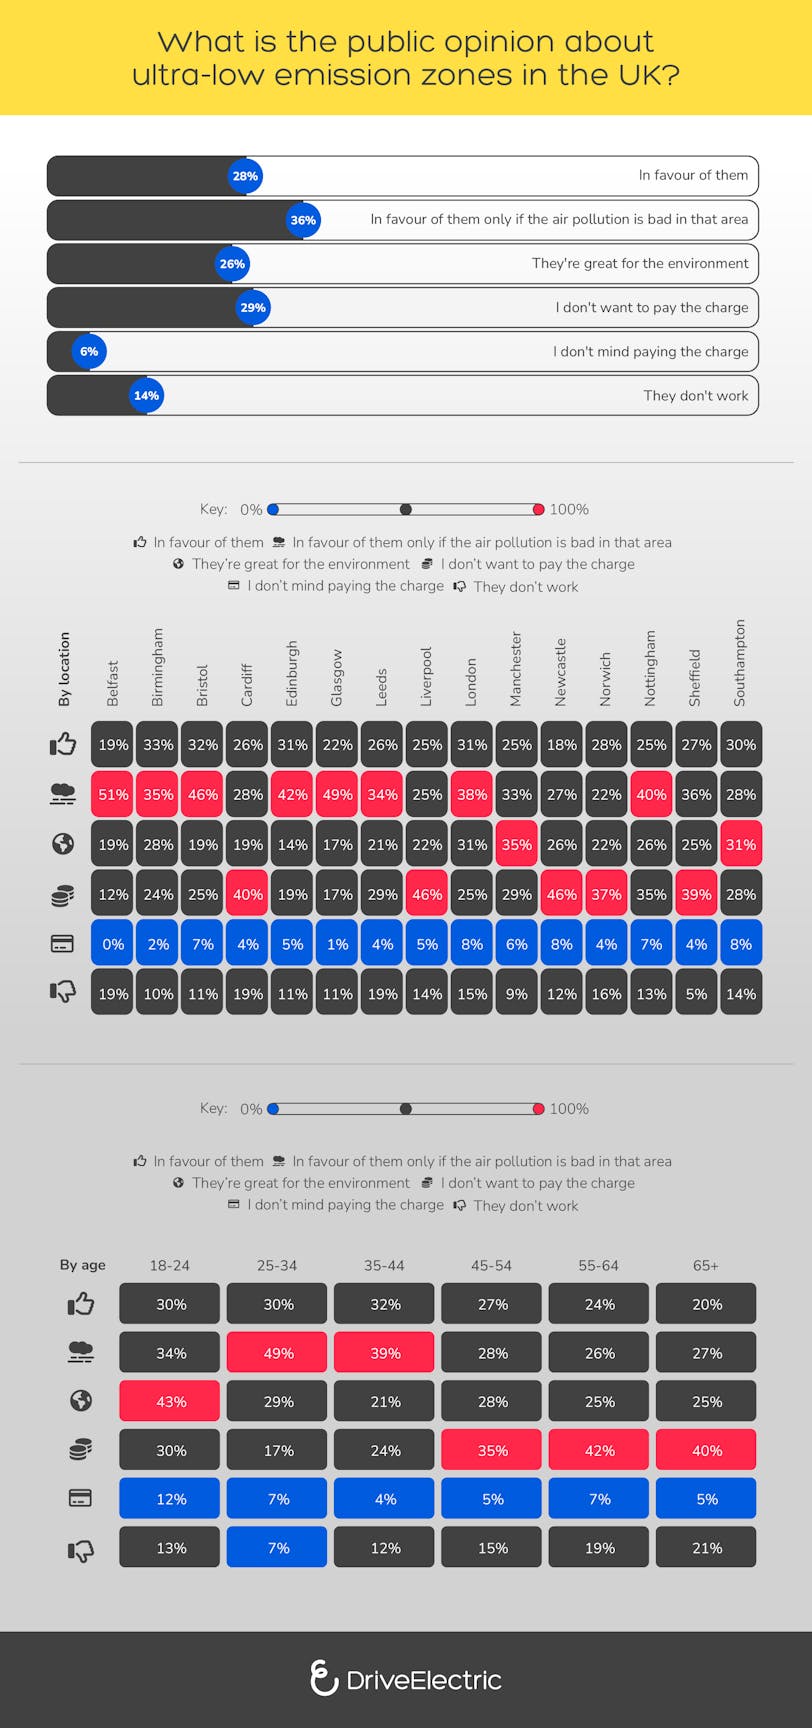
As for sentiments on ultra-low emission zones, almost three in ten (26%) of respondents do not want to pay the charge, this is perhaps largely due to the cost of living crisis, which is tightening most people’s budgets. Whereas over a third of people (36%), are in favour of such zones, but only if there is a lot of air pollution in the area.
Different areas in the UK have quite different viewpoints on ULEZ. London, the biggest sample size from the survey, had almost two-fifths (38%) of people in favour of them if air pollution is proven to be bad in the area. However, in Cardiff, one in five (19%) thought that these zones don’t work, which was the highest for that particular response among the cities surveyed.
Out of all the age groups, those 18 to 24 had the highest number of people who outright support ULEZ. And almost half of the 25 to 34-year-olds responded that they supported them only if air pollution was bad in the area. Those aged 65 and older were the age group that had the most responses against ULEZ, with just over one-fifth responding that they don’t work.
Methodology -
We wanted to look at which areas in the UK were the most expensive for driving vehicles with internal combustion engines versus electric vehicles.
To get the petrol and diesel prices for each UK region, we used Fleet News (data valid from 01/03/2023) and to get them for each London borough, we used Car Giant (prices accurate as of April 2022). As for the electricity rate, we used the Ofgem rate, as the government doesn’t release regional electricity rates per kWh.
Then using the most commonly owned internal combustion engine vehicles: Ford Fiesta for cars and Ford Transit Custom for vans, we calculated the cost to fuel those vehicles per 100 miles for petrol and diesel. We then did the same for electric vehicles: using the Tesla Model Y for electric cars and the Ford E-Transit (in this case, we used the highest-rated van, due to scarcity of data on the most commonly owned electric vans) for electric vans, we then calculated how much it would cost to run those per 100 miles. We then finally calculated the price differences for each UK region and London borough.
We then referenced information from the Transport for London site for the ultra-low emission zone in London and the RAC, as well as Wikipedia for the clean air zones section.
We then finally surveyed 2,001 drivers in the UK via TLF Research, to find out the types of vehicles people drive and their opinions on ultra-low emission zones. Note: when the survey was selected respondents were allowed to “select all that apply” and therefore many will have chosen multiple options, which may have lead to some percentages adding up to more than 100%.