The greenest residents
We’ve taken a look at a range of areas across the UK to determine which ones have the greenest residents, including which areas have the most eco-friendly vehicles, the most public green spaces, and the lowest energy consumption rates.

With more and more people in the UK committed to combating climate change, environmentally friendly practices such as electric car leasing and lowering daily energy consumption, are becoming adopted. Whether you prefer a certain type of car, like a hatchback or an SUV, or you have a favourite car and van brand, such as Ford or Audi, there are options for everyone when it comes to electric cars.
We’ve taken a look at a range of areas across the UK to determine which ones have the greenest residents, including which areas have the most eco-friendly vehicles, the most public green spaces and the lowest energy consumption rates.
The greenest areas
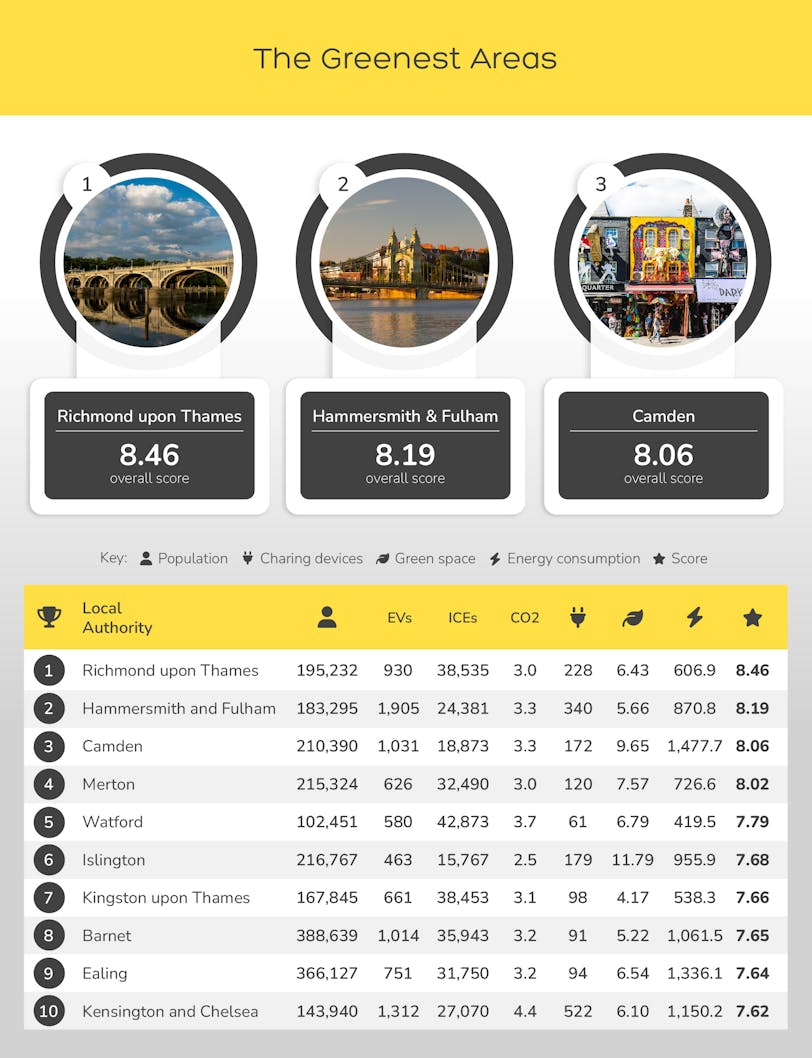
1. Richmond Upon Thames - 8.46 overall score
The title of the greenest resident goes to Richmond Upon Thames, which has an overall score of 8.46. There are 930 licensed electric vehicles per 100,000 people within the town, as well as 228 charging devices and an average of 6.43 public green spaces within a 1,000m radius.
Richmond Upon Thames also has 38,535 licensed ICE vehicles per 100,000 people, as well as just 3 tonnes of CO2 emissions per capita and an energy consumption of 606.9 GWh.
2. Hammersmith & Fulham - 8.19 overall score
Next is the London borough of Hammersmith and Fulham, with an overall score of 8.19. There are 1,905 licensed electric vehicles per 100,000 people within the borough, as well as 340 charging devices and an average of 5.66 public green spaces within a 1,000m radius.
Hammersmith and Fulham also have 24,381 licensed ICE vehicles per 100,000 people, as well as just 3.3 tonnes of CO2 emissions per capita and an energy consumption of 870.8 GWh.
3. Camden - 8.06 overall score
In third place is the London borough of Camden, which has an overall score of 8.06. There are 1,031 licensed electric vehicles per 100,000 people within the town, as well as 172 charging devices and an average of 9.65 public green spaces within a 1,000m radius.
Camden also has 18,873 licensed ICE vehicles per 100,000 people, as well as just 3.3 tonnes of CO2 emissions per capita and an energy consumption of 1,477.7 GWh.
The least green areas
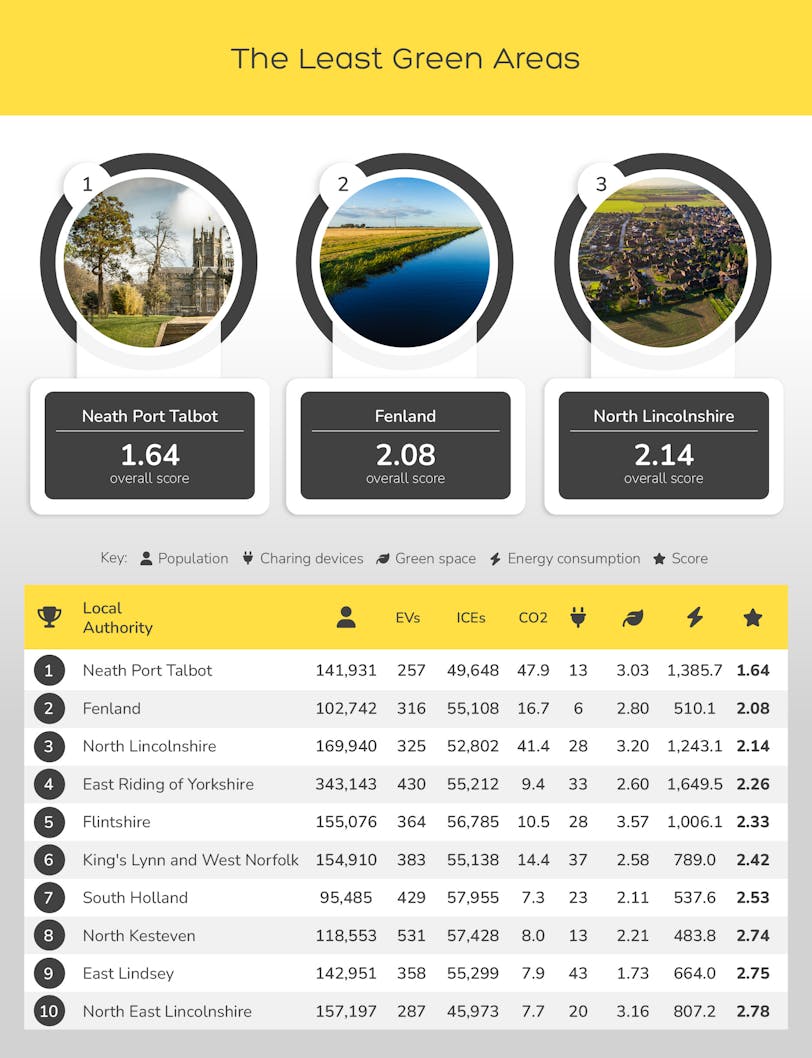
1. Neath Port Talbot - 1.64 overall score
Topping the list is the Welsh county borough of Neath Port Talbot, with an overall score of just 1.64. There are just 257 licensed electric vehicles per 100,000 people within the borough, as well as only 13 charging devices and an average of 3.03 public green spaces within a 1,000m radius.
Neath Port Talbot also has 49,648 licensed ICE vehicles per 100,000 people, as well as 47.9 tonnes of CO2 emissions per capita and an energy consumption of 1,385.7 GWh.
2. Fenland - 2.08 overall score
Next is the district of Fenland, which can be found in Cambridgeshire, and has an overall score of just 2.08. There are just 316 licensed electric vehicles per 100,000 people within the district, as well as only 6 charging devices and an average of 2.8 public green spaces within a 1,000m radius.
Fenland also has 55,108 licensed ICE vehicles per 100,000 people, as well as 16.7 tonnes of CO2 emissions per capita and an energy consumption of 510.1 GWh.
3. North Lincolnshire - 2.14 overall score
In third place is North Lincolnshire, with an overall score of just 2.14. There are just 325 licensed electric vehicles per 100,000 people within the area, as well as 28 charging devices and an average of 3.2 public green spaces within a 1,000m radius.
North Lincolnshire also has 52,802 licensed ICE vehicles per 100,000 people, as well as 41.4 tonnes of CO2 emissions per capita and an energy consumption of 1,243.1 GWh.
The areas with the most electric vehicles
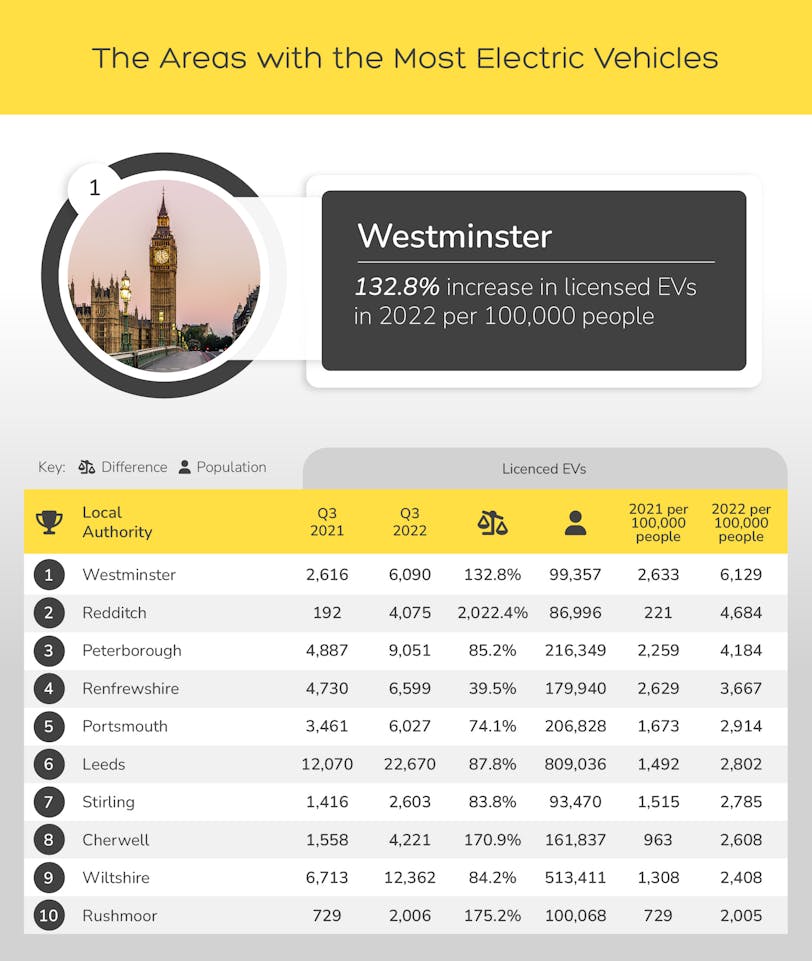
1. Westminster
Topping the list is the London borough of Westminster, with 6,129 electric vehicles per 100,000 people. Back in 2021, there were just 2,633 electric vehicles per 100,000, showing an increase of 132.8%.
Westminster has a population of approximately 99,357 people and in total, there are currently 6,090 electric vehicles in the London borough. This is compared to just 2,616 electric vehicles back in 2021.
2. Redditch
Next is the town of Redditch, which can be found in northeast Worcestershire. In 2021, there were just 221 electric vehicles per 100,000 people. In 2022, this figure increased by a huge 2022.4%, to 4,684 electric vehicles per 100,000.
Redditch has a population of around 86,996 people and in 2021, there were just 192 electric vehicles in total in the town. This figure now stands at 4,075 electric vehicles.
3. Peterborough
In third place is the city of Peterborough, which can be found in the east of England. There are currently 4,184 electric vehicles per 100,000 people in the city, compared to 2,259 back in 2021. This shows an increase of 85.2%.
Peterborough has a population of approximately 216,349 people and there are currently a total of 9,051 electric vehicles within the city. This is compared to 4,887 total electric vehicles in 2021.
The areas with the fewest electric vehicles
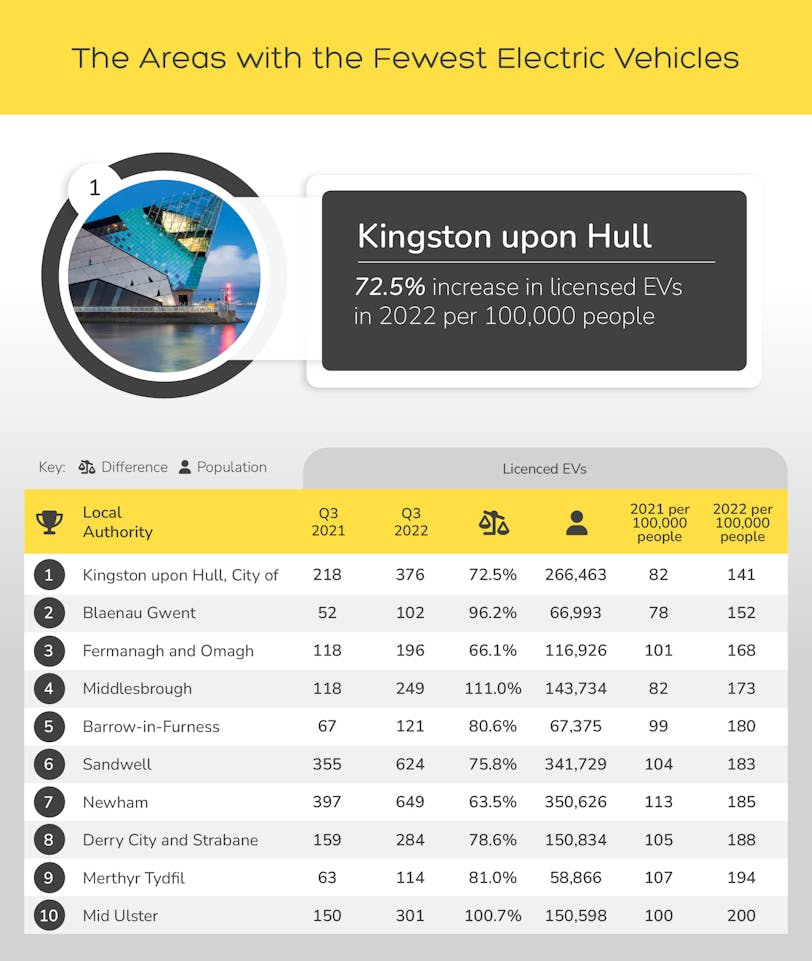
1. Kingston upon Hull
At the top of the list is the city of Kingston upon Hull, with 141 electric vehicles per 100,000 people. Back in 2021, there were 82 electric vehicles per 100,000, showing an increase of 72.5%.
Kingston upon Hull has a population of around 266,463 people and in total, there are currently 376 electric vehicles in the city. This is compared to 218 electric vehicles back in 2021.
2. Blaenau Gwent
Next is the Welsh county borough of Blaenau Gwent, where there were 78 electric vehicles per 100,000 people in 2021. This figure has now increased to 152 electric vehicles per 100,000, showing a percentage change of 96.2%.
Blaenau Gwent has a population of approximately 66,993 people and in 2021, there were just 52 electric vehicles in total in the borough. This figure now stands at 102 electric vehicles.
3. Fermanagh & Omagh
In third place is Fermanagh and Omagh, which can be found in the southwestern area of Northern Ireland. There are currently 168 electric vehicles per 100,000 people in the area, compared to 101 electric vehicles back in 2021. This shows an increase of 66.1%.
Fermanagh and Omagh have a population of around 116,926 people and there are currently a total of 196 electric vehicles within the area. This is compared to 118 total electric vehicles in 2021.
The areas with the most ICE vehicles
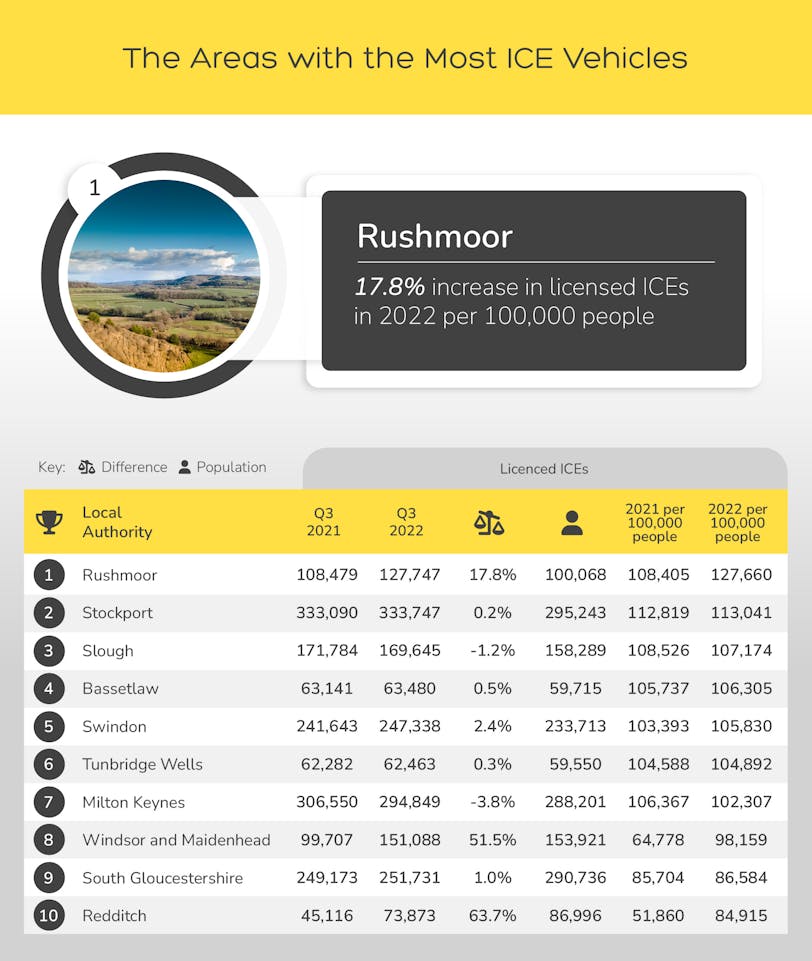
1. Rushmoor
Topping the list is the district of Rushmoor, which can be found in Hampshire. In 2021, there were 108,405 ICE vehicles per 100,000 people. In 2022, this figure increased by 17.8%, to 127,660 ICE vehicles per 100,000.
Rushmoor has a population of approximately 100,068 people and in 2021, there were 108,479 ICE vehicles in total within the district. This figure now stands at 127,747 total ICE vehicles.
2. Stockport
Next is the town of Stockport, where there were 112,819 ICE vehicles per 100,000 people in 2021. This figure has now increased to 113,041 ICE vehicles per 100,000, showing an increase of 0.2%.
Stockport has a population of around 295,243 people and there are currently 333,747 ICE vehicles in total within the town. This is compared to 333,090 total ICE vehicles in 2021.
3. Slough
In third place is the town of Slough, which can be found in Berkshire. In 2021, there were 108,526 ICE vehicles per 100,000 people within the town. By 2022, this figure had actually decreased to 107,174, showing a percentage change of -1.2%
Slough has a population of approximately 158,289 people and in 2021, there were 171,784 ICE vehicles in total within the town. This figure now stands at 169,645 total ICE vehicles.
The areas with the fewest ICE vehicles
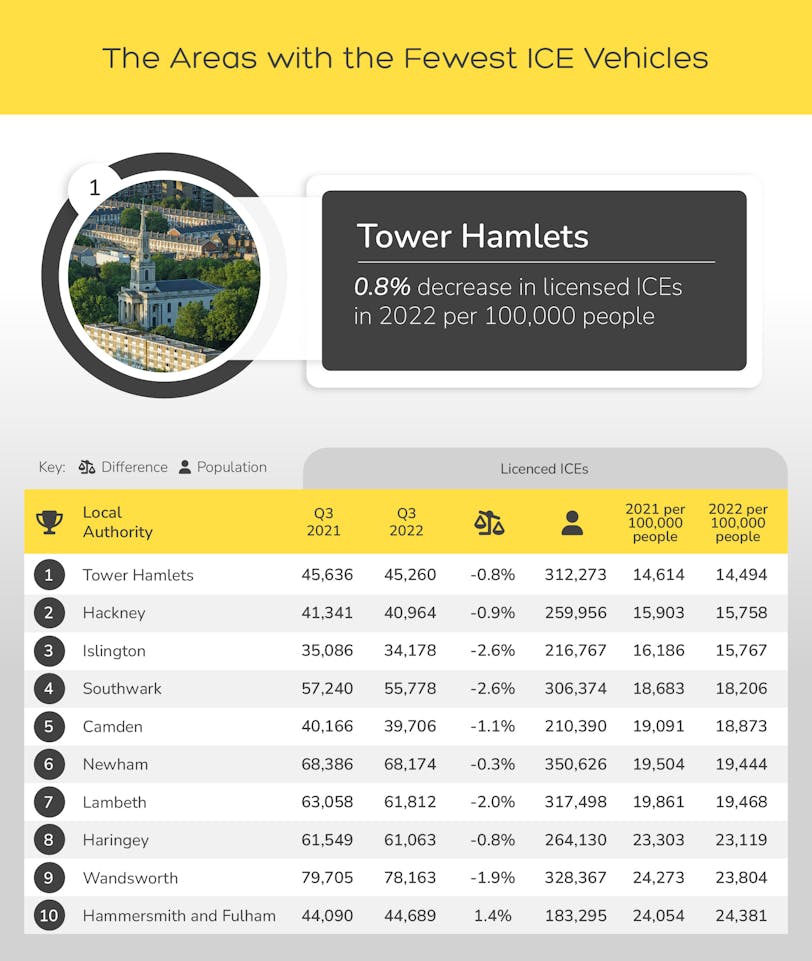
1. Tower Hamlets
At the top of the list is the London borough of Tower Hamlets. In 2021, there were 14,614 ICE vehicles per 100,000 people. By 2022, this figure had decreased to 14,494 ICE vehicles per 100,000, showing a percentage change of -0.8%.
Tower Hamlets has a population of around 312,273 people and there are currently 45,260 ICE vehicles in total within the London borough. Back in 2021, this figure stood at 45,636 total ICE vehicles.
2. Hackney
Next is the London borough of Hackney, where there are currently 14,494 ICE vehicles per 100,000 people. In 2021, this figure stood at 15,903 ICE vehicles per 100,000, showing a decrease of 0.9%.
Hackney has a population of approximately 259,956 people and in 2021, there were 41,341 ICE vehicles in total within the borough. By 2022, this figure had decreased to 40,964 total ICE vehicles.
3. Islington
In third place is the London borough of Islington, where, back in 2021, there were 16,186 ICE vehicles per 100,000 people. In 2022, this figure decreased to 15,767 ICE vehicles per 100,000 showing a decrease of 2.6%.
Islington has a population of around 216,767 people and there are currently 34,178 ICE vehicles in total within the area. Back in 2021, this figure stood at 35,086 total ICE vehicles.
The areas with the most public charging devices for electric vehicles
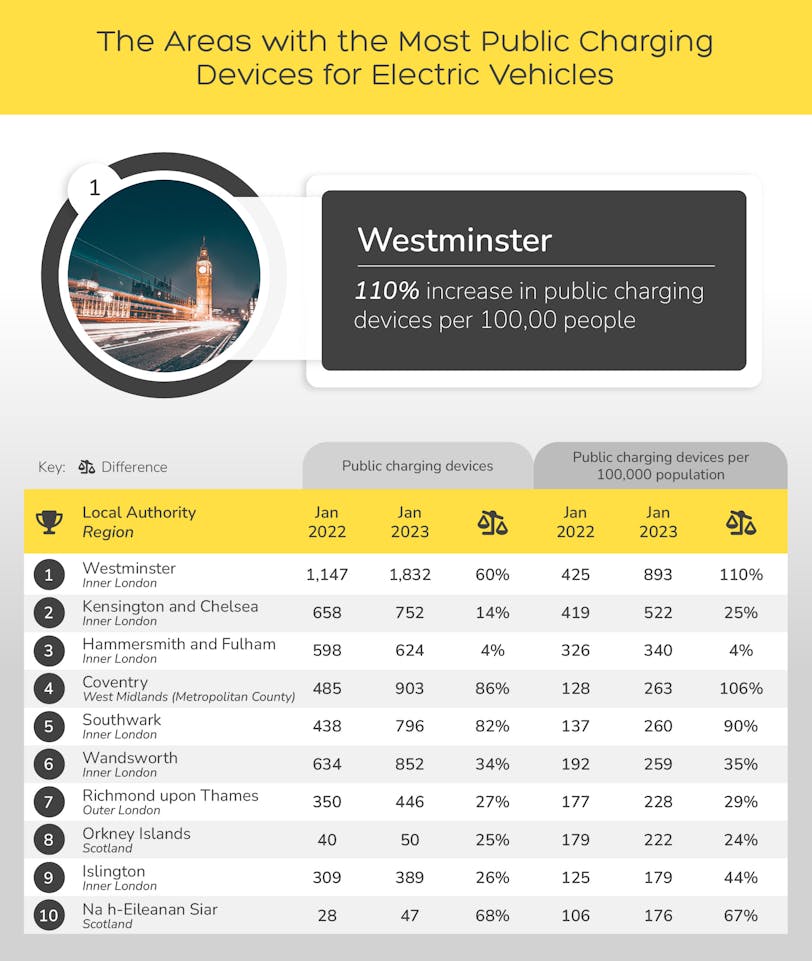
1. Westminster
Topping the list is Westminster, where, as of January 2023, there are 893 public charging devices for electric vehicles per 100,000 people. This is compared to 425 devices in January 2022, which shows an increase of 60%.
This means that there are now 1,832 public charging devices in total within the borough, compared to 1,147 the previous year, which shows an increase of 110%.
2. Kensington & Chelsea
Next is the London borough of Kensington & Chelsea, where there are currently 522 public charging devices per 100,000 people. This is compared to 419 devices in January 2022, which shows an increase of 14%.
This means that there are now 752 public charging devices for electric vehicles in total within the area, compared to 658 devices the previous year, showing an increase of 25%.
3. Hammersmith & Fulham
In third place is the borough of Hammersmith and Fulham, where, as of January 2023, there are 340 public charging devices for electric cars per 100,000 people. This is compared to 326 devices back in January 2022, showing an increase of 4%.
This means that there are now 624 public charging devices for electric vehicles in total within the area, compared to 598 devices the previous year, which, again, shows an increase of 4%.
The areas with the fewest public charging devices for electric vehicles
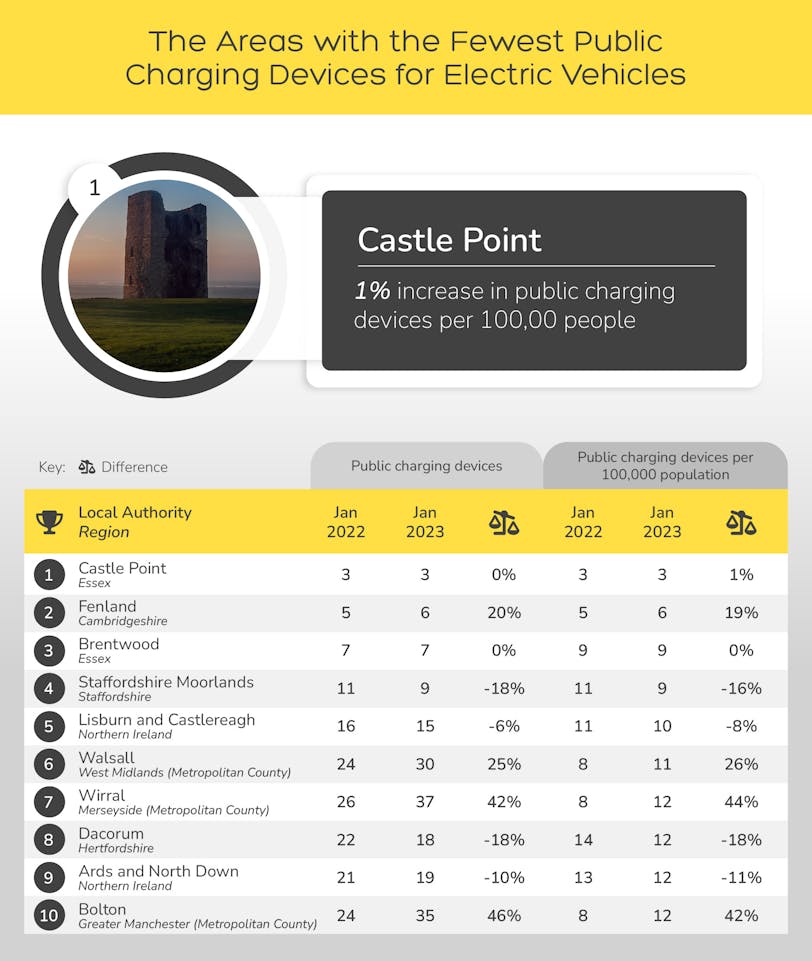
1. Castle Point
Topping the list is Castle Point, an area in the south of Essex. The number of public charging devices has remained stagnant in Castle Point from January 2022 to January the following year, with just three being available.
This means that only 3.3 public charging devices are available per 100,000 people throughout Castle Point.
2. Fenland
In second place is Fenland, which currently has six public charging devices available for electric vehicles. This is compared to five charging devices in January 2022, showing an increase of 20%.
This means that there were previously 4.9 public charging devices available per 100,000 people. This figure has now risen to 5.8, which is an increase of 19%.
3. Brentwood
Coming in third is the town of Brentwood. Like Castle Point, the number of public charging devices has also remained stagnant in Brentwood since January 2022, with just seven being available.
This means that there are 9.1 public charging devices available per 100,000 people throughout Brentwood.
The areas with the highest CO2 emissions per capita
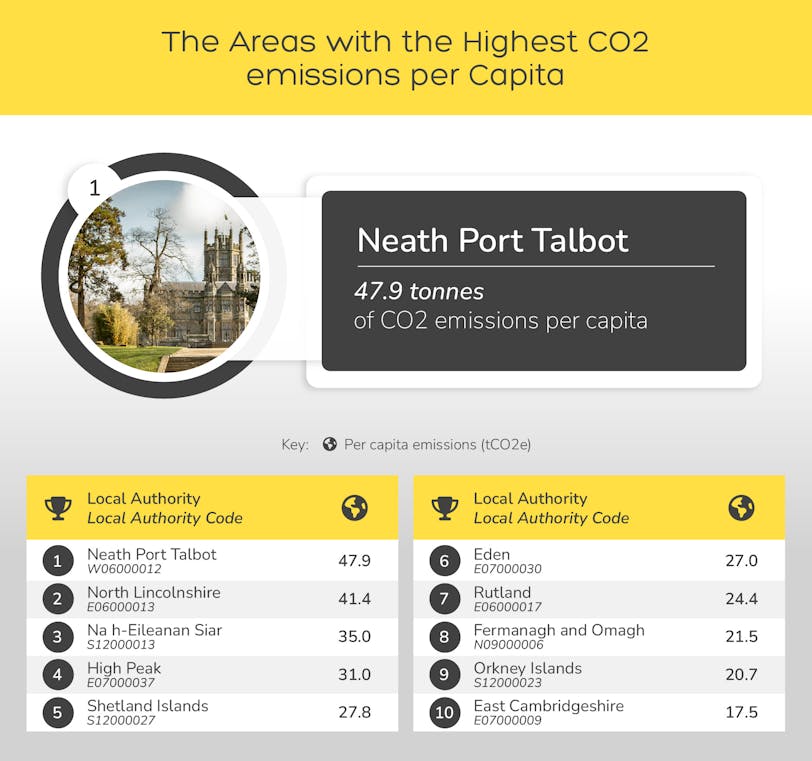
1. Neath Port Talbot - 47.9 tonnes of CO2 emissions per capita
Topping the list is the Welsh county borough of Neath Port Talbot, which has CO2 emissions of 47.9 tonnes per capita.
In 2022, Neath Port Talbot was revealed as the UK’s worst region for CO2 emissions, emitting 7.17 million tonnes each year. The Port Talbot Steelworks is the country’s largest steel production plant, which contributes to the area’s high CO2 emissions.
2. North Lincolnshire - 41.4 tonnes of CO2 emissions per capita
Next up is North Lincolnshire, with 41.4 tonnes of CO2 emissions per capita.
In December, it was announced that planning permission had been granted for the UK’s first carbon capture and storage power station, near Scunthorpe, in North Lincolnshire. The proposed plant has the capacity to capture up to 1.5 million tonnes of CO2 per year.
3. Outer Hebrides (Na h-Eileanan Siar) - 35 tonnes of CO2 emissions per capita
In third place are the Outer Hebrides (also known as Na h-Eileanan Siar), with 35 tonnes of CO2 emissions per capita.
Earlier this year, NHS Scotland released a new Climate Energy and Sustainability Strategy (2022-2026), which includes becoming carbon net-zero by 2040, as well as reducing waste and making theatres greener. The NHS currently accounts for approximately 4% of the UK’s total carbon emissions.
The areas with the least CO2 emissions per capita
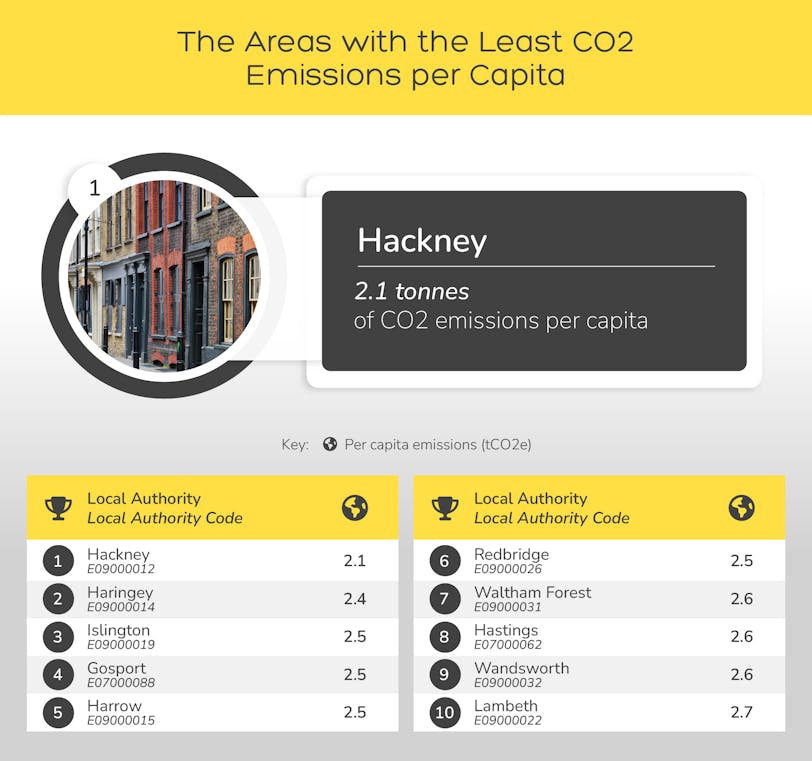
1. Hackney - 2.1 tonnes of CO2 emissions per capita
Topping the list is the London borough of Hackney, with just 2.1 tonnes of CO2 emissions per capita.
Hackney Council has committed to delivering net zero emissions by 2040, which is 10 years earlier than the target set by the government. When the commitment was made, the council promised to work with other local governments in order to discover the best ways to limit climate change, as well as putting these methods into practice.
2. Haringey - 2.4 tonnes of CO2 emissions per capita
Next is the London borough of Haringey, with 2.4 tonnes of CO2 emissions per capita.
Haringey Council is working to become a net zero-carbon council by the year 2027. They aim to do this by removing carbon from frontline vehicles, as well as making energy-efficient retrofit measures to core council operational buildings and all transport-related activities.
3. Islington - 2.5 tonnes of CO2 emissions per capita
Not far behind, in third place, is the London borough of Islington, with 2.5 tonnes of CO2 emissions per capita.
Islington Council previously had a target of reducing the area’s carbon emissions by 40% between the years 2005 and 2020. By 2019, they had already exceeded this target and achieved a 45% reduction.
The areas with the most public green spaces
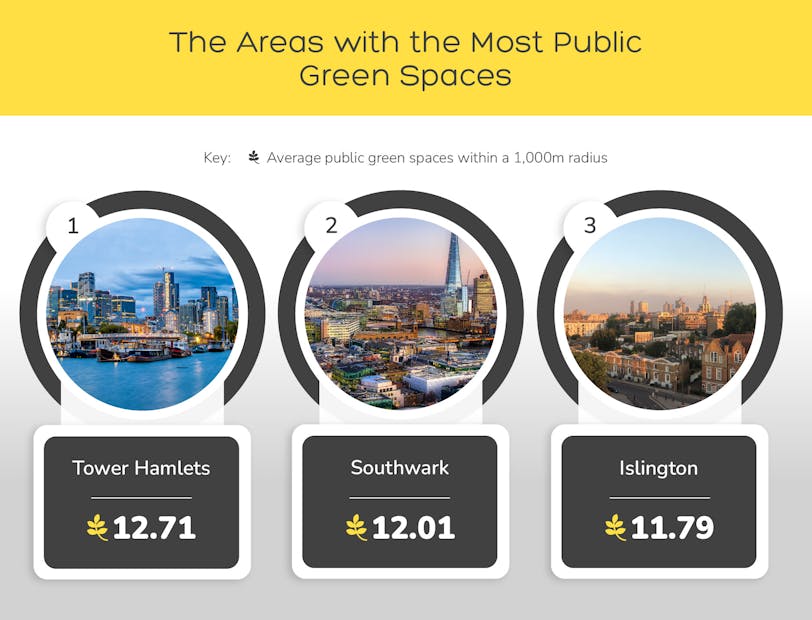
1. Tower Hamlets - an average of 12.71 public green spaces within a 1,000m radius
Topping the list is the London borough of Tower Hamlets. The area has an average of 12.71 parks, public gardens, or playing fields within a 1,000m radius, as well as an average distance of 204m to these areas.
The average combined size of all green spaces within a 1,000m radius in Tower Hamlets is 390,710 m2. Victoria Park is both the largest and oldest park in the borough of Tower Hamlets, attracting around nine million visitors per year.
2. Southwark - an average of 12.01 public green spaces within a 1,000m radius
In second place is Southwark, another borough in London. There are an average of 12.01 parks, public gardens, or playing fields within a 1,000m radius in Southwark and an average distance of 220m to these areas.
The average combined size of all green spaces within a 1,000m radius of Southwark is 470,010 m2. Burgess Park is Southwark’s largest park, expanding across 56 hectares, and was developed between the 1950s and 1980s.
3. Islington - an average of 11.79 public green spaces within a 1,000m radius
The London borough of Islington is in third place, with an average of 11.79 parks, public gardens, or playing fields within a 1,000m radius. The average distance to green spaces in this area is 224m.
The average combined size of all green spaces within a 1,000m radius in Islington is 268,317 m2. Highbury Fields is Islington’s largest park and features many sports facilities, including an artificial turf football pitch, four netball courts, 11 tennis courts, and a table tennis table.
The areas with the highest energy consumption
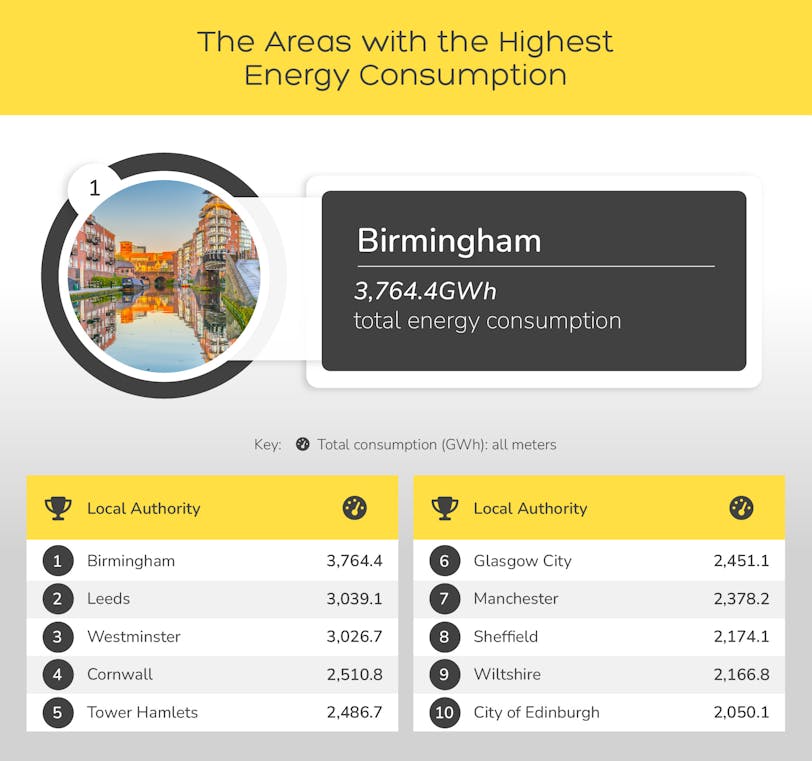
1. Birmingham - 3,764.4GWh
Topping the list is the city of Birmingham, with an energy consumption of 3,764.4 GWh.
In August last year, figures from the Department for Business, Energy and Industrial Strategy showed that the average household in Birmingham was using a median amount of approximately 2,893.3kWh of electricity and 13,406.98kWh of gas in the year 2020.
2. Leeds - 3,039.1GWh
Next is the city of Leeds, with an energy consumption of 3,039.1 GWh.
Figures from the Department of Business, Energy and Industrial Strategy showed that, in 2020, 1,249GWh of electricity were consumed by electric meters in Leeds, which is an increase of 5% from the previous year and the largest change since comparable records were introduced in 2012.
3. Westminster - 3,026.7GWh
In third place is the London borough of Westminster, with an energy consumption of 3,026.7 GWh.
Last year, Westminster Council were forced to introduce a range of national support schemes for those struggling with their energy bills. This included London Support schemes, which provided free heating, insulation and ventilation improvements for London residents with low incomes, who either own their own homes or rent privately.
The areas with the lowest energy consumption
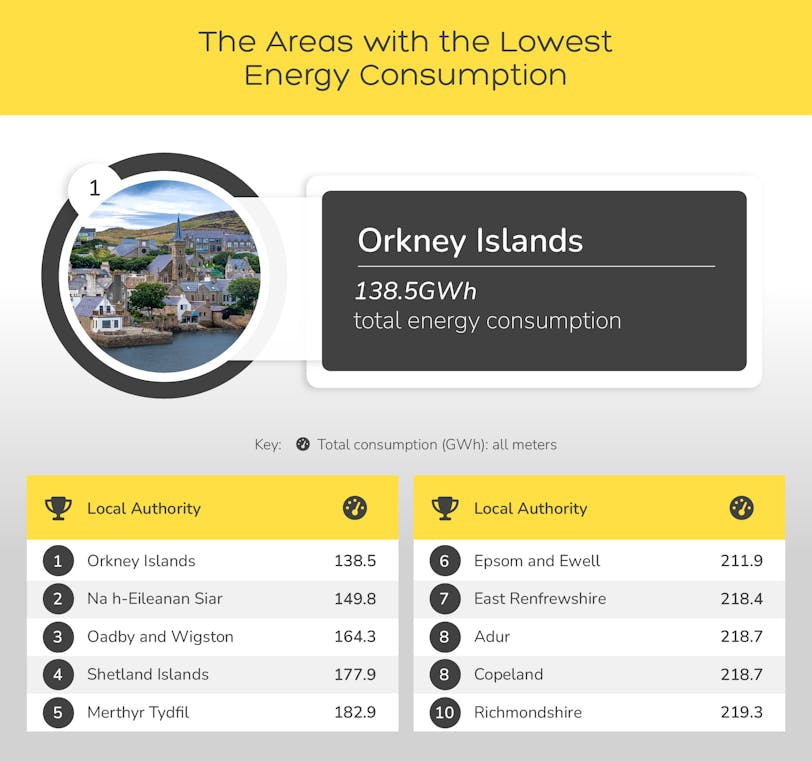
1. Orkney Islands - 138.5GWh
Topping the list are the Orkney Islands, with an energy consumption of 138.5 GWh.
The islands are some of the biggest pioneers of renewable energy, with more than 650 wind turbines and almost 400 solar installations scattered across the landscape, as well as some experimental devices used to generate power from waves and tides.
2. Outer Hebrides (Na h-Eileanan Siar) - 149.8GWh
Next are the Outer Hebrides (also known as Na h-Eileanan Siar), with an energy consumption of 149.8 GWh.
The Outer Hebrides Renewables Group has an objective of coordinating renewable energy activity both in and around the Western Isles, to achieve economy of scale, and is supported by the likes of AMEC/EDF (Stornoway Windfarm), Galson Energy, and West Harris Renewables.
3. Oadby & Wigston - 164.3GWh
In third place is Oadby and Wigston, with an energy consumption of 164.3 GWh.
Within the area, there are multiple organizations, such as Energy Saving Trust and Centre for Sustainable Energy, that provide support and advice to the residents on how to reduce carbon emissions and use water more sustainably, as well as save money on their energy bills.
Methodology
Overall score - For the main ranking, we ranked the following six factors, giving each a normalized score out of 10 for each factor, before taking our final overall score as an average across all six factors. Charging points data was unavailable for the Isles of Scilly, so the overall score for this local authority was calculated using each of the remaining five factors. A small number of areas were removed from the overall ranking due to more than one data point being unavailable.
Number of licensed EV’s - we used Gov.uk in order to find out how many licensed electric vehicles there were throughout the UK in the third quarter of both 2021 and 2022. We calculated the number of licensed electric vehicles per 100,000 people by dividing the number of electric vehicles by the area’s population, before multiplying the figure by 100,000. We then calculated the percentage change between the two figures by subtracting the 2021 figure from the 2022 figure, before dividing this number by the 2021 figure and turning it into a percentage.
As the data also includes places with EV leasers, such as Slough and brokers areas, we have removed areas with brokers to ensure the data is as accurate as possible. Places with 5,000 or more EVs were taken out aside from those with a high population.
Number of licensed ICE vehicles - we used Gov.uk again to find out how many licensed internal combustion engine vehicles there were throughout the UK in the third quarter of both 2021 and 2022. We calculated the number of licensed ICE vehicles per 100,000 people by dividing the number of ICE vehicles by the area’s population, before multiplying the figure by 100,000. We then calculated the percentage change between the two figures by subtracting the 2021 figure from the 2022 figure, before dividing this number by the 2021 figure and turning it into a percentage.
Number of public charging devices - we used Gov.uk to find out how many public charging devices for electric cars there were throughout the UK in January of both 2022 and 2023. We calculated the number of public charging devices per 100,000 people by dividing the number of public charging devices by the area’s population, before multiplying the figure by 100,000. We then calculated the percentage change between the two figures by subtracting the 2022 figure from the 2023 figure, before dividing this number by the 2022 figure and turning it into a percentage. No data was available for the Isles of Scilly.
CO2 emissions - we used Gov.uk in order to find out the per capita CO2 emissions for each local authority.
Number of green spaces - we used the Office for National Statistics in order to find out the average number of parks, public gardens, and playing fields within a 1,000m radius of various areas throughout the UK. We also looked at the average distance to the nearest of these areas, as well as the average combined size of the green spaces in each area.