Green growth
The world’s greenest countries revealed

As people across the globe become more conscious about their impact on the environment, many countries are already setting the bar high when adopting sustainable practices, from the widespread adoption of electric vehicles and EV charging to ambitious net-zero goals.
To determine which countries are pioneering a new era of sustainability by taking on environmental responsibility, the DriveElectric team decided to take a deep dive into the most eco-conscious nations.
We reveal the nations making the most impressive strides in fostering green habits by looking at various factors, such as the countries that use the most renewable energy, EV sales, and solar panels. In addition, we shed light on the nations putting environmentally friendly innovative strategies at the forefront of global consciousness.
We also explore countries addressing environmental issues the fastest and those that have embraced the green movement, moving towards a brighter, more sustainable future.
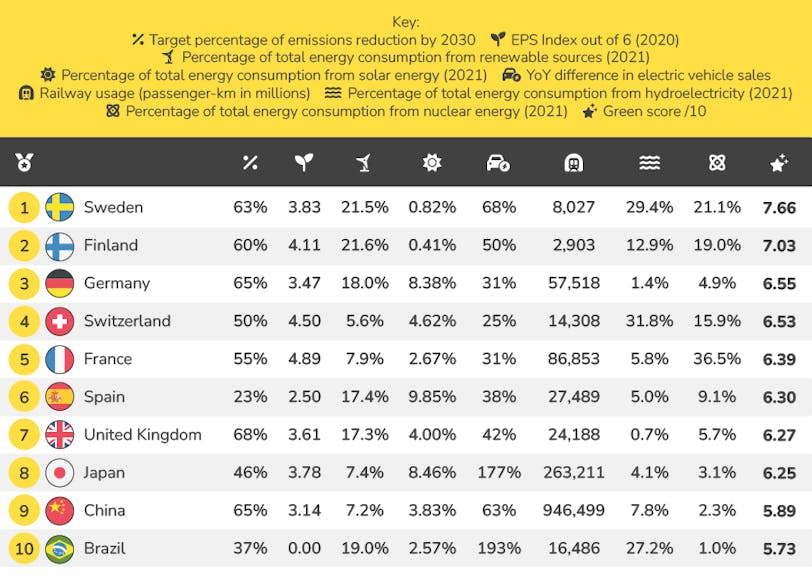
The greenest countries in the world
1. Sweden
Green score - 7.66/10
Known as one of the most sustainable countries in the world, Sweden takes first place as the greenest country. The country has several low carbon dioxide emissions and strong renewable energy programs, which are contributing towards the country’s goal of becoming fossil fuel-free and running solely on 100% renewable energy by 2045.
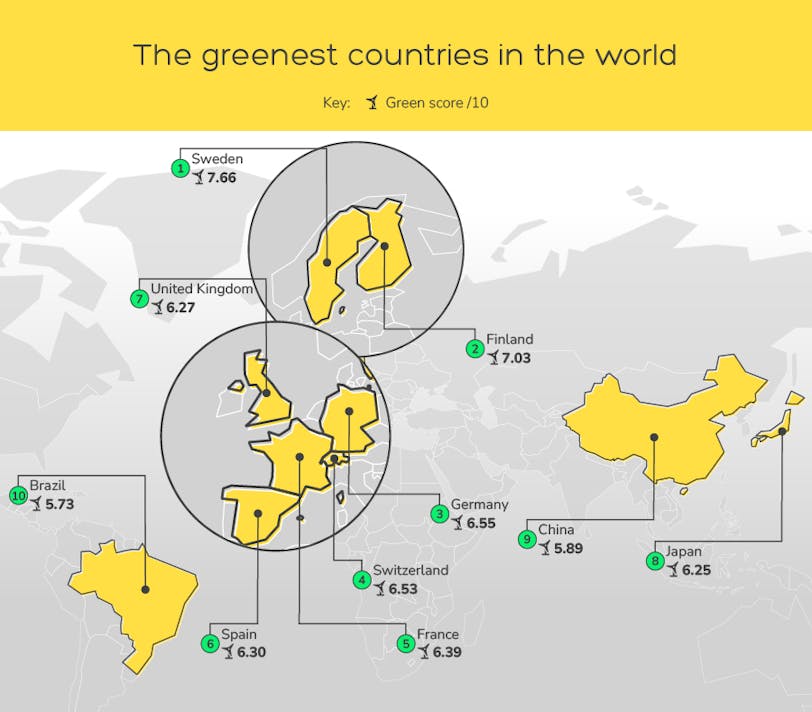
2. Finland
Green score - 7.03/10
Regarded as having a strong reputation as a leader in environmental policy and sustainable development, Finland comes second, scoring 7.03 out of 10. Committed to becoming carbon neutral by 2035, the country’s renewable energy sources account for around 40% of end consumption and continue to focus on curbing industrial emissions and protecting its biodiversity.
The Nordic country has one of the most stringent environmental policies, with an Environmental Policy Stringency Index (EPS) index of 4.11 out of 6.
3. Germany
Green score - 6.55/10
Germany is the third greenest country with a score of 6.55 out of 10. According to the country’s Climate Protection Act, it aims to achieve greenhouse gas neutrality by 2045. Germany also has high hopes, with an ambitious goal of running on 100% green power by 2035. Regarding recycling, the nation is said to be a world leader in recycling over 60% of its waste into new products such as paper and glass or fuel.
Countries with the best environmental policies
1. France
EPS Index: 4.89/6
When it comes to the country with the best environmental policies, France takes the crown with an EPS index of 4.89 out of 6. The EPS index considers the degree of stringency of 13 environmental policy instruments related to climate and air pollution.
Considered a world leader in sustainable initiatives, the French parliament passed a climate change bill in 2021 to reduce packaging waste, prohibit open-air terrace heaters and prevent future airport expansions.
2. Switzerland
EPS Index: 4.50/6
Ranking in second place is Switzerland, with an EPS index of 4.50 out of 6. Said to be one of the world’s most eco-friendly countries, Switzerland was the first country to vote for implementing a green economy.
In recent years, there have been measures taken by the Swiss Confederation to achieve a more sustainable environment. Nearly 60% of the country’s electricity comes from hydropower and reduced emissions from furnaces, industrial and commercial operations, as well as combustion engine-driven machinery. This has had a positive impact on the country’s air quality.
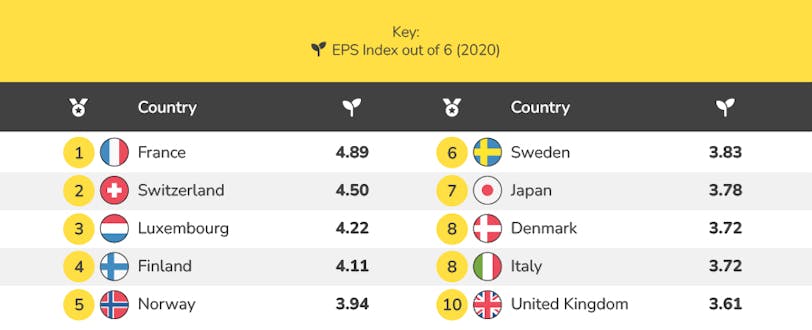
3. Luxembourg
EPS Index: 4.22/6
Regarded as a pioneer in sustainable activities, Luxembourg is committed to reducing its greenhouse gas emissions by 55% by 2030. On a national scale, the country’s objective is to achieve climate neutrality by 2050.
Luxembourg has several sustainable initiatives, including promoting electric cars and bikes, package-free fruit and vegetables, and its own eco-village. With so many green initiatives in place, it is no surprise that Luxembourg ranks third with an EPS index of 4.22 out of 6.
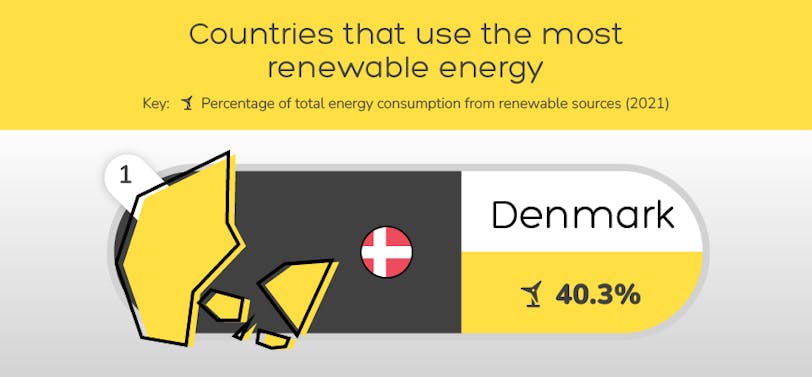
Countries that use the most renewable energy
1. Denmark
Percentage of renewable energy consumption: 40.3%
A leading country in renewable energy production and usage, it is no surprise that Denmark takes the lead with a renewable energy consumption of 40.3%.
In 2022 alone, an estimated three-quarters of the country’s electricity generation was collectively produced from renewable energy sources. By 2030, it is estimated that these renewable sources will provide 100% of the nation’s electric power production.
2. Finland
Percentage of renewable energy consumption: 21.6%
Ranking in second place is Finland, with 21.6% renewable energy consumption in 2021. A global leader in producing second-generation biofuels, some of the country’s most important forms of renewable energy include bioenergy, hydroelectric power and wind power. By 2030, Finland aims to increase its use of renewable energy to more than 50% of its end-consumption.
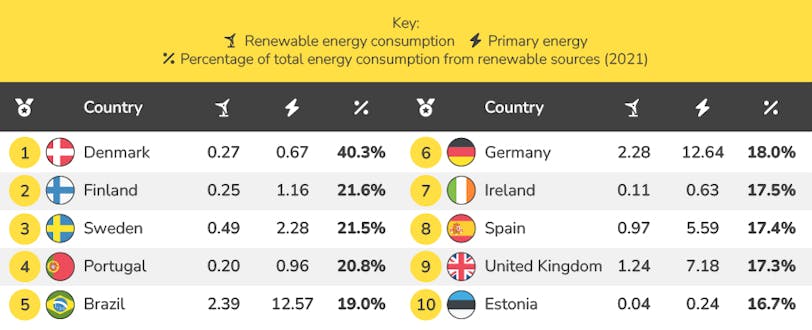
3. Sweden
Percentage of renewable energy consumption: 21.5%
Sweden takes third place with an estimated 21.5% renewable energy consumption.
Seeking a greener future, the Swedish government has set ambitious targets for sustainability. This includes using 100% renewable energy and going fossil-free by 2045.
With the increase in the nation’s green activities over the years, Sweden is getting closer to its net zero target. In fact, in 2021, Sweden saw an increase of nearly 70% in EV sales, significantly reducing the country’s carbon footprint.
Countries with the highest solar power consumption
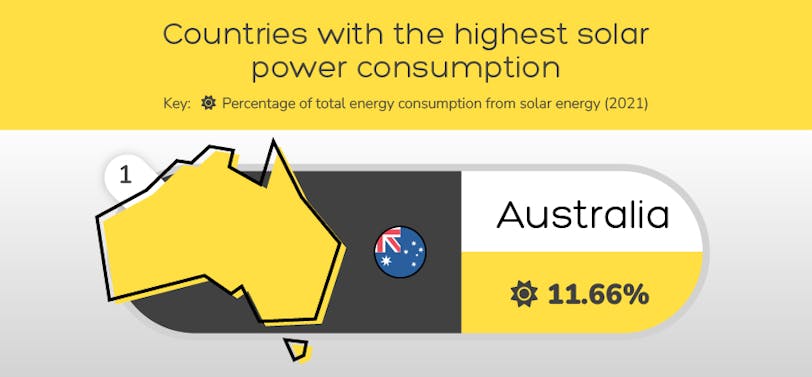

1. Australia
Percentage of solar power consumption: 11.66%
Australia grabs first place as the country with the highest solar panel consumption, with 11.66% of its energy coming from solar panels. The adoption of solar power is fast-growing in the country. It is also the fastest-growing generation type, with more than 30% of Australian households having a rooftop solar PV, which equates to a combined capacity exceeding 11 GW.
2. Hungary
Percentage of solar power consumption: 10.61%
Hungary takes second place with a solar power consumption of 10.61%. Thanks to government support and declining system prices, solar power in Hungary has experienced rapid advancement.
In recent years, the country launched its largest solar power plant to date, which is expected to account for 8% of the total domestic solar-generated electricity.
3. Spain
Percentage of solar power consumption: 9.85%
Completing the top three countries with the highest solar power consumption is Spain with 9.85%. The country is considered a world leader in solar power production.
Spain’s solar power capacity is expected to see strong growth as its energy strategy could accommodate an additional 65 GW of photovoltaic (PV) capacity installation by 2030.
Countries with the highest hydroelectricity consumption
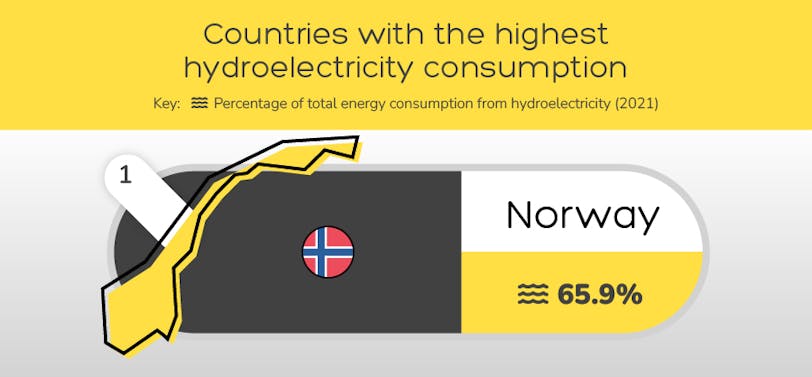
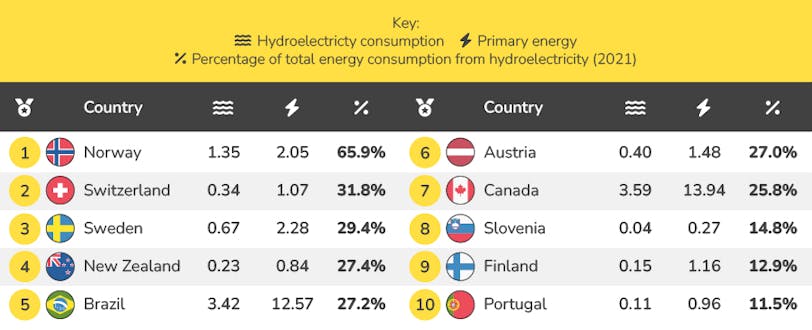
1. Norway
Percentage of hydroelectricity consumption: 65.9%
Well known for abundant natural lakes and steep valleys, Norway’s topography lends itself nicely to hydropower development. In 2021, hydroelectricity accounted for 65.9% of the total Norwegian power production, while the remainder came from thermal and wind energy. The Scandinavian country is committed to reducing emissions by at least 40 % by 2030.
2. Switzerland
Percentage of hydroelectricity consumption: 31.8%
Switzerland currently has a whopping 682 hydroelectric power stations with a capacity of over 300 kilowatts. Hydropower is a cornerstone of Switzerland's energy policy. In 2021, 31.8% of its electricity came from hydroelectricity, making it one of the country's most important domestic sources of renewable energy.
3. Sweden
Percentage of hydroelectricity consumption: 29.4%
As Sweden’s most significant renewable energy, in 2021, hydroelectricity accounted for just under 30% of Swedish electricity generation. Together with nuclear power, hydropower is said to be the foundation of the country’s electricity system. Hydropower in Sweden operates on zero carbon emissions, and the water used is returned to the river after leaving the turbine.
Countries with the highest nuclear energy consumption
1. France
Percentage of nuclear energy consumption: 36.5%
With one of the world's most extensive nuclear power programs, it is no surprise that France tops the list, with over a third (36.5%) of its energy consumption coming from nuclear power.
In 2021, nuclear power plants in France generated an estimated 361 billion kilowatt-hours of electricity. This accounted for more than two-thirds of the country’s annual electricity generation, the highest nuclear generation share in the world.
2. Sweden
Percentage of nuclear energy consumption: 21.1%
In 2021, nuclear energy provided an estimated 21.1% of the country’s electricity. Sweden currently operates on six reactors located at three different sites that supply almost a third of its electricity, with hydroelectricity providing most of the rest in its fossil-free energy mix.
3. Slovakia
Percentage of nuclear energy consumption: 19.7%
Slovakia has a combined net power capacity of 2,308 MWe with five operational nuclear reactors. The country also has the potential to build a new nuclear reactor as electricity consumption continues to increase. In 2021, Slovakia’s nuclear energy consumption was almost a fifth (19.7%) of its primary energy.
Countries with the highest increase in EV sales
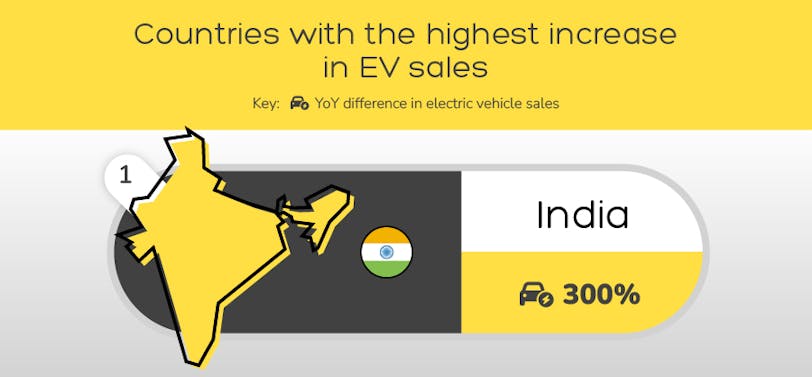

1. India
YoY percentage difference: 300%
Unlike China, Europe and the US, India is not a hub for purchasing electric cars. However, the country’s demand for electric vehicles skyrocketed by 300% in just one year. EV sales in the South Asian country were four times higher than in 2021 after almost hitting 50,000 battery electric vehicle sales in 2022.
2. Brazil
YoY percentage difference: 193%
Brazil follows behind with a year-on-year increase of 193% in EV sales. The country's adoption of electric vehicles has seen steady growth over the last few years. Compared to 2021, which saw an estimated 2,900 EV sales, Brazil's demand for electric cars rose to 8,500 by 2022.
3. New Zealand
YoY percentage difference: 179%
Due to the increasing environmental awareness of the global climate crisis, the New Zealand government introduced the “clean car” rebate scheme in 2021, which allows buyers of new or used, low or zero-emissions vehicles to claim back up to $8,000 (NZ) of the price.
The scheme's popularity has led to an increase of 179% in EV sales, a record high. Electric car sales went from 6,800 in 2021 to 19,000 new purely electric vehicles registered in the country.
Countries with the highest railway usage
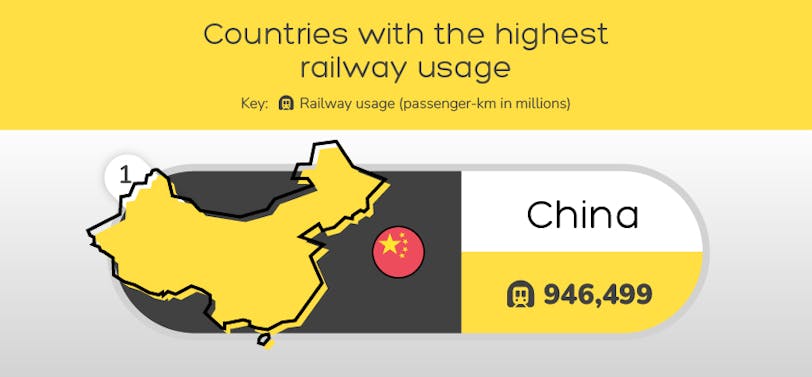

1. China
YoY percentage difference: 946,499
China takes first place with the highest railway usage of 946,499 million passenger kilometres in 2021. Railways play a significant role in passenger travel in the country. China’s railroad network also saw an increase of 2.5% in the same year. The country’s railroad network has increased by 65% in over a decade.
2. Japan
YoY percentage difference: 263,211
In second place is Japan, with 263,211 million passenger kilometres in 2020. Research suggests that around 40% of the total passenger travel in Japan is by railway transport. This is significantly more when compared to other countries, such as the United States, which is said to have 90% of people opting for road transport.
3. India
YoY percentage difference: 321,126
India ranks third with 231,126 million passenger kilometres. This is unsurprising as the South Asian country has the fourth-largest rail network in the world. According to the research, India saw an average of 22.15 million passengers use the Indian Railways network daily between 2019 and 2020.
Methodology
To find out which countries have fostered the greenest habits, we looked at various factors, including the percentage of renewable energy consumption, rail transport of passengers, EV sales, percentage of solar power consumption, target percentage of emissions reduction and Environmental Policy Stringency (EPS) Index.
To calculate the overall green score of each country, we looked at over 30 countries. For the countries missing at least one or two factors, we put a 0 for their missing factors. We then used a weighted ranking system to calculate an overall average, which was then ranked to determine the country with the highest green score.
Using a Net Zero Tracker, we collected data on each country's Net Zero goals. By looking at the 2023 scorecard, we ranked each country based on their target percentage of emissions reduction. Please note that we only looked at countries with available data for most of the other factors, so this list is not ranked on every country’s sustainability goals.
The EPS Index was taken from OECD. This measures the stringency of environmental policy across different countries. To source data for more countries, we used CEIC data. The index is based on the degree of stringency of 13 environmental policy instruments, from climate to air pollution. The index also ranges from 0 (not stringent) to 6 (highest degree of stringency) and covers 40 countries. We used the most recent data, which was from 2020.
We sourced data from BP’s Statistical Review of World Energy to determine which countries have the highest renewable energy consumption. Using figures of each country’s renewable consumption in exajoules (input-equivalent, p.43), we calculated this as a percentage of each country’s primary energy consumption (p.8) in 2021 to determine how much of the consumed energy is renewable. This was also done for hydroelectricity (p.42) and nuclear energy (p.41).
We sourced data on the countries with the most solar energy by calculating the solar capacity (p.45) compared to its total electricity generation (p.50) to get the percentage of the total energy consumption from solar energy.
To find out which nations saw the most increase in EV Sales year-on-year (2021-2022), we used historical data from a Global EV Data Explorer. The figures used were filtered by Battery Electric Vehicles (BEVs). We only took into account countries; e.g. data for ‘Other Europe’ and ‘Rest of the world’ were not considered due to being too broad.
Using Eurostat, we gathered data on the rail transport of passengers in each country. We used figures from the World Bank to source data for non-European countries. This was measured based on the passenger kilometres in millions. These figures were then ranked in order using the most recent data available for each country.
Data collection for all the above sections was completed on 04/09/2023.